
Fig. 3.
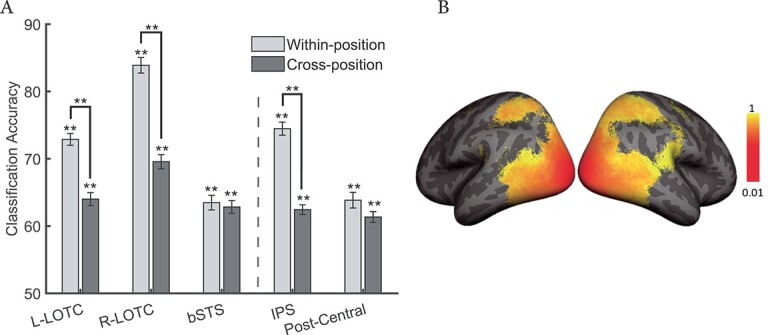
(A) Within and cross-position decoding accuracy for the ROIs obtained from searchlight analysis. Error bars indicate standard errors of the means (**group analysis at q1 = 0.01, q2 = 0.01 or paired t-test, P < 0.01, FDR-corrected). The vertical dashed line separates occipitotemporal ROIs from parietal ROIs. (B) Maps of cross-position divided by within-position classification accuracy obtained from searchlight analysis in vertices with significant within-position classification accuracy.