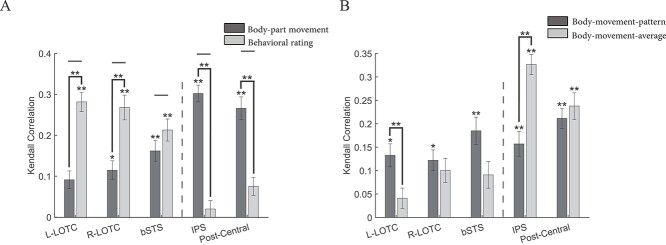
Fig. 4.
Brain-Model correlations: (A) Kendall correlation body-part movement (dark gray) and behavioral rating models (light gray) and cross-position pairwise decoding accuracies for the individual ROIs. Error bars indicate standard errors of the mean (permutation test or paired t-test, *P < 0.05, **P < 0.01, FDR-corrected). The vertical dashed line separates occipitotemporal ROIs from parietal ROIs. The horizontal lines indicate the lower limit of the noise ceiling. (B) Kendall correlation between body-movement-average (light gray) and body-movement-pattern (dark gray) models and cross-position pairwise decoding accuracies for individual ROIs. Error bars indicate standard errors of the mean (permutation test or paired t-test, *P < 0.05, **P < 0.01, FDR-corrected). The vertical dashed line separates occipitotemporal ROIs from parietal ROIs.

