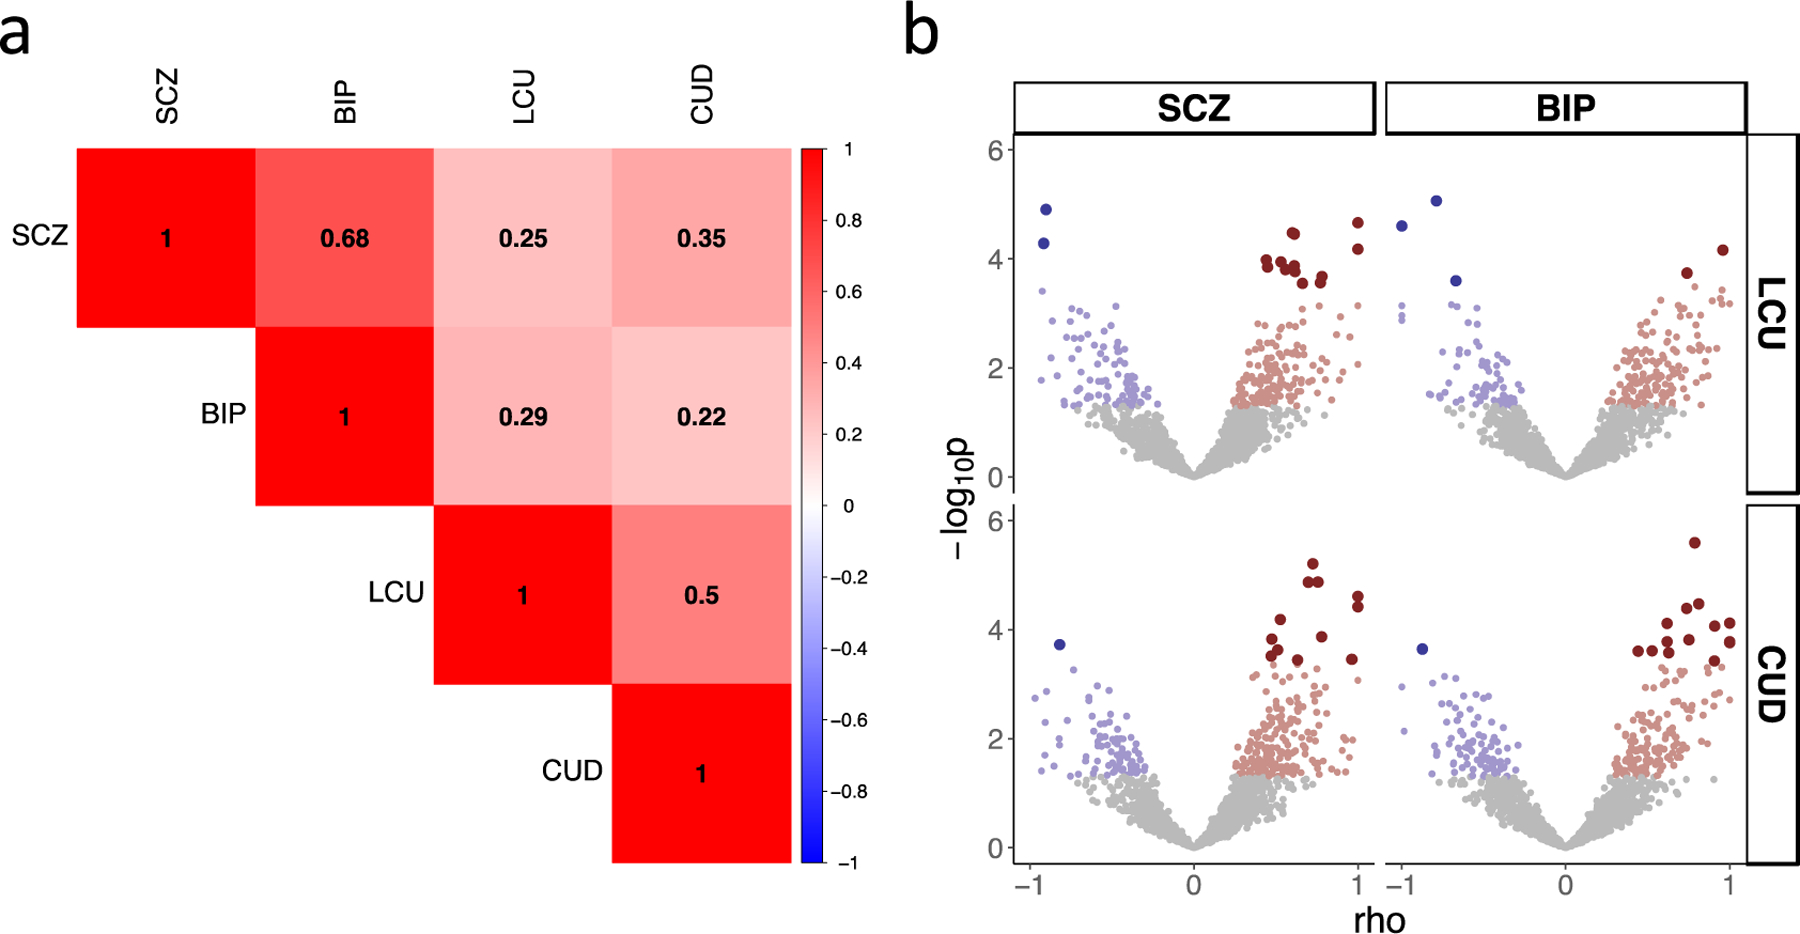
Figure 2. Genome-wide and Local Genetic Correlations.

A) Results of genome-wide genetic correlations where numbers represent the correlation coefficient. All correlations were significant after correction for multiple comparisons. B) Results of local genetic correlations with positive (red) and negative (blue) correlation across regions of the genome (each represented by one point). Grey points are genetic correlations with a p>0.05. Correlations with p<0.05 are represented in red or blue depending on the direction of effect. Correlations surviving correction for multiple comparison are represented by larger points that are darker in color. SCZ: schizophrenia; BIP: bipolar disorder; LCU: lifetime cannabis use; CUD: cannabis use disorder.
