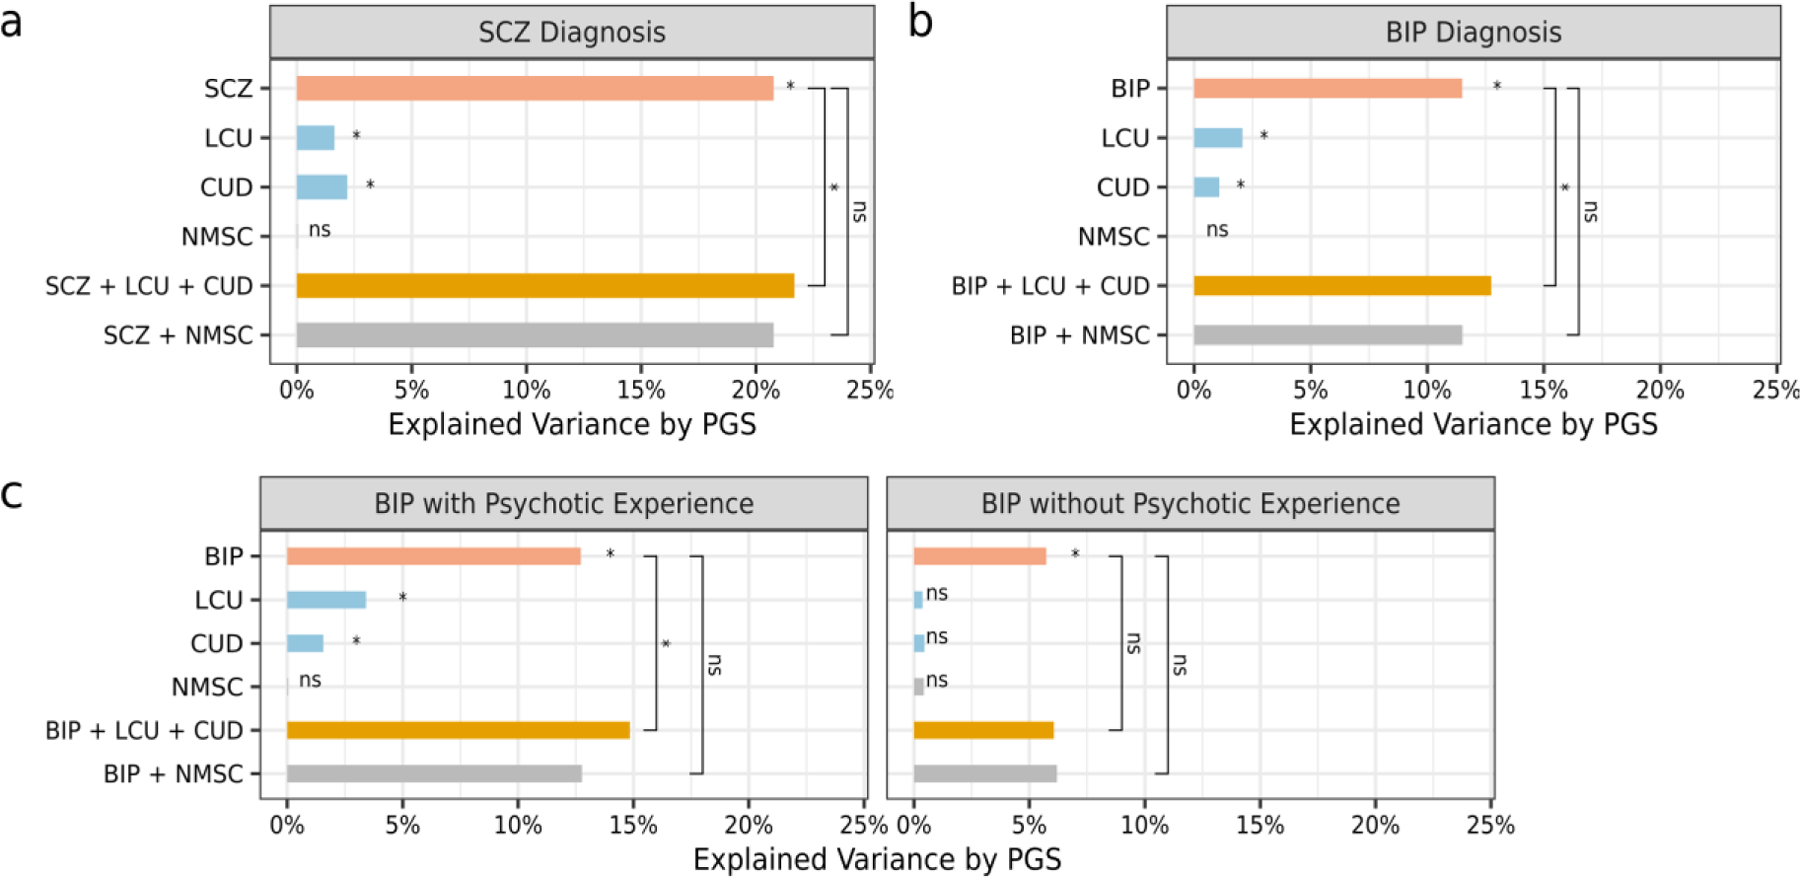
Figure 4. Polygenic Risk Prediction.

A comparison of variance explained by polygenic scores (PGS) in single- and multi-PGS models to predict patients from healthy controls, including schizophrenia (SCZ) (A), bipolar disorder (BIP) (B), and BIP with and without psychotic experience (C). Pink represents the single-PGS model with the psychotic-specific PGS and covariates only. Blue represents single-PGS models with covariates and PGS of lifetime cannabis use (LCU) or of cannabis use disorder (CUD). Orange represents the multi-PGS model with the psychotic-specific PGS, LCU- and CUD- PGSs, and covariates. Grey represents comparison models that include the PGS for nonmelanoma skin cancer (NMSC). Significance after Benjamini-Hochberg correction is indicated using * or ns for non-significant.
