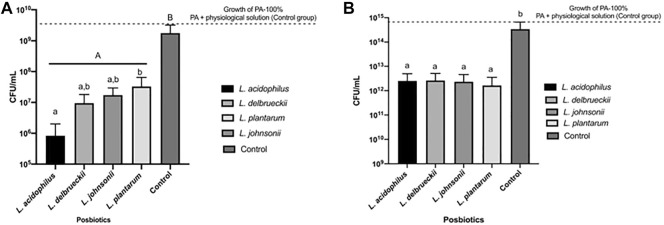
FIGURE 1.
Growth expressed by P. aeruginosa obtained by counting the CFU/mL in the antibacterial activity in vitro test for 24 h in the presence of Lactobacilli supernatants. The supernatants of four Lactobacilli strains were tested. (A) Graph of 100% growth of PA 2853™ (1.71 ± 1.44 × 10⁹ CFU/mL) and the CFU/mL of PA in the presence of different Lactobacillus supernatant. (B) Graph of 100% growth of PA 9027™ (3.05 ± 3.18 × 10¹⁴ CFU/mL) and the CFU/mL of PA in the presence of different CFSMs. Different capital letters refer to significant differences (p < 0.05) between treatments and the control group by ANOVA followed by Tukey’s post hoc test. Different lowercase letters indicate statistically significant differences (p < 0.05) between the tested treatments by ANOVA followed by Tukey’s post hoc test.

