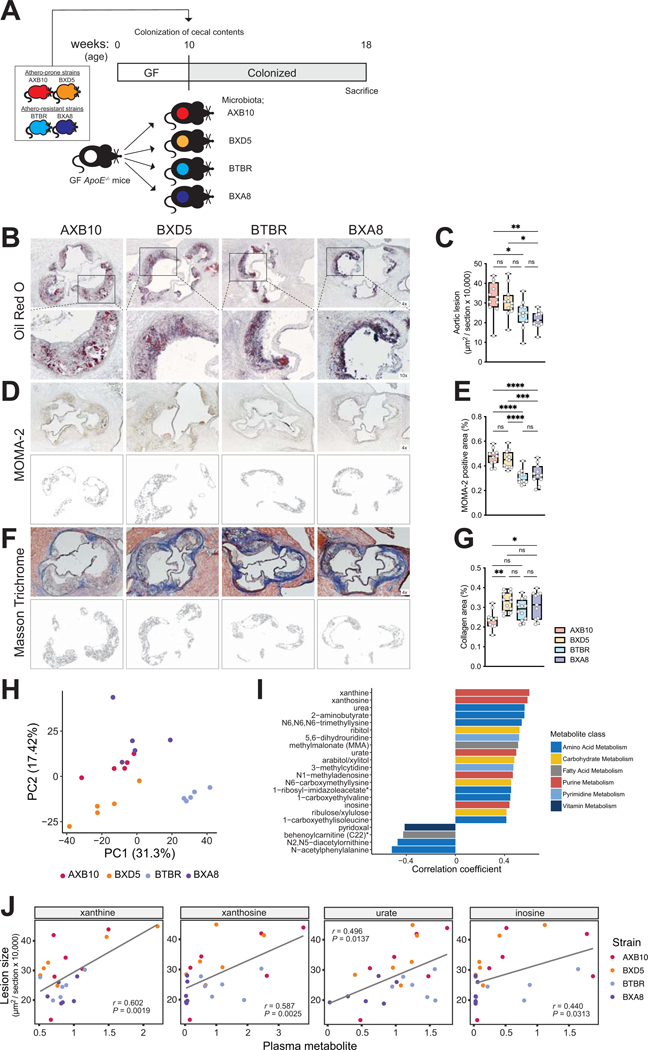
Figure 1. Plasma levels of purines are associated with atherosclerosis burden in transplanted gnotobiotic ApoE KO mice.
A) Experimental design. B-G) Representative sections and quantitative analysis of Oil Red O staining (B, C), MOMA-2 staining (D, E), and Masson’s trichrome staining (F, G) in the aortic sinus (n=11 for AXB10, n=12 for BXD5, n=12 for BTBR group, n=11 for BXA8). The data are expressed as box-and-whisker plots with individual data points, where the boxes indicate the median values and the interquartile ranges and the whiskers represent the minimum and maximum values. Significance was calculated by one-way ANOVA with the Tukey post-tests is indicated as follows: *, p-value <0.05; **, p-value of <0.01; ****, p-value of <0.0001. H) Principal component analysis of gut microbial functions from transplanted mice as determined by metagenomic analysis. I) Plasma metabolites positively or negatively associated with atherosclerotic lesion size, according to Spearman correlation analysis. J) Scatterplots showing associations between purines (relative mass spectrometry scaled intensities) and atherosclerosis lesion size (x104 μm2). GF; germ-free, ApoE; Apolipoprotein E, Chol; cholesterol, MOMA; monocytes and macrophages.

