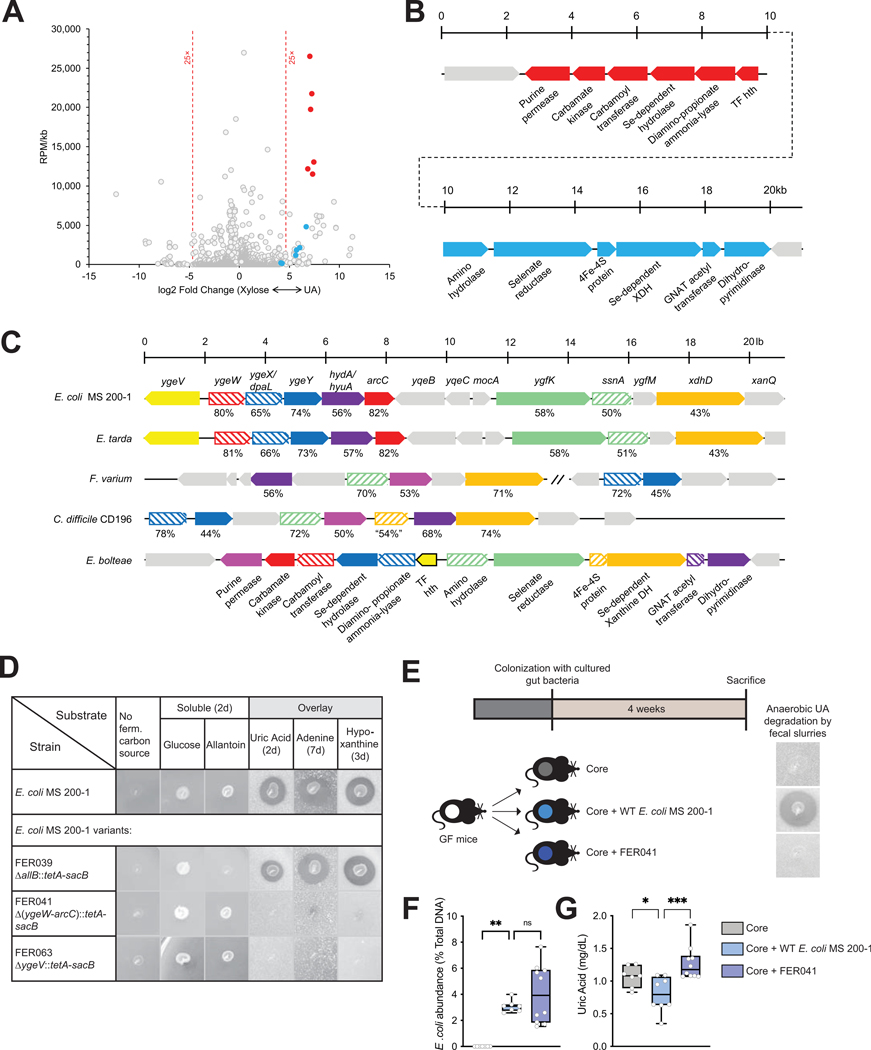
Figure 6. Identification of a gene cluster necessary for anaerobic bacterial growth on purines.
A) Comparison of transcriptional profiles for Enterocloster bolteae showing differentially-expressed genes (FDR <0.01) and reads per million (RPM)/gene size (kb) for cultures grown on xylose + NH4Cl (“Xylose,” upregulated genes to the left) or uric acid (upregulated genes to the right), highlighting genes encoding two adjacent predicted operons encoding functions likely necessary for uric acid metabolism (blue and red circles). Descriptions of additional upregulated genes including those encoding micronutrient transport, one glycine cleavage system and a probable bifurcating hydrogenase system as well as genes upregulated during growth on xylose are described in Suppl. Fig. 7. B) Diagram of the adjacent upregulated predicted operons, including genes CGC65_RS20560-RS20625, color-matched with the filled circles in panel (A). C) Representative alignments of chromosomal regions from multiple organisms that anaerobically catabolize uric acid. The genetic regions from E. bolteae shown in panel B are compared to those from Clostridioides difficile CD196 (CD196_RS16070 – RS16115), Fusobacterium varium (C4N18_RS01955 – RS01995) and (C4N18_RS03270 – RS03290), Edwardsiella tarda (ETATCC_RS03320 – RS03390) and E. coli MS 200–1 (HMPREF9553_RS03160 - RS03225). Matched genes are color-coded, and the percent similarities of the encoded proteins are indicated. Although selected genes appear to be conserved, their organization differs in different organisms, and in the case of F. varium do not occur in a contiguous chromosomal region. D) Growth of E. coli MS 200–1 wild-type and deletion variants (FER039 [ΔallB::tetA-sacB], FER041 [Δ(ygeW-arcC)::tetA-sacB], and FER063 [ΔygeV::tetA-sacB]) on plates lacking a carbon source, supplemented with glucose or allantoin, or prepared with overlays containing saturating amounts of uric acid, adenine, or hypoxanthine. E) In vivo experimental design. Mice were colonized with the Core community as in Fig. 5 and with either E. coli MS 200–1 wild-type or the deletion variant FER041 [Δ(ygeW-arcC)::tetA-sacB]. Anaerobic uric acid degradation by fecal samples from different groups is indicated using uric acid overlay plates. F) The levels of fecal E. coli in the bacterial communities were assessed by qPCR and (G) plasma uric acid levels measured by HPLC were expressed as box-and-whisker plots with individual data points, where the boxes indicate the median values and the interquartile ranges and the whiskers represent the minimum and maximum values. Significance was calculated by one-way ANOVA test with the Tukey post-tests and is designated as follows: *, p-value of <0.05; ***, p-value of <0.001.

