
Figure 2.
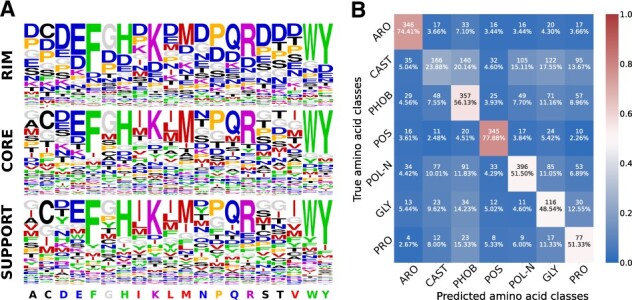
Performance of ssDLA model. (A) The predictive power of ssDLA model is evaluated on the validation set of ‘PDBInter’. The three logos represent the propensities of each amino acid to be predicted (having maximum score in the output layer), depending on the true amino acid (x-axis) and on its SR (see Section 2). Amino acids are colored based on seven similarity classes: ARO (F, W, Y, H) in green, CAST (C, A, S, T) in black, PHOB (I, L, M, V) in red, POS (K, R) in purple, POL-N (N, Q, D, E) in blue, GLY (G) in gray and PRO (P) in orange (see Section 2). (B) Confusion matrix for the prediction of the seven amino acid classes using embedding vectors generated by ssDLA. The percentage values and the colors indicate recall. The model is trained and tested on the interfacial residues of X-ray crystal structures of S2003. See Supplementary Fig. S5 for the performance of ssDLA when only four channels corresponding to the four amino acid-independent chemical elements (O, C, N, and S) are considered to define the cubic volumetric maps.