
Figure 3.
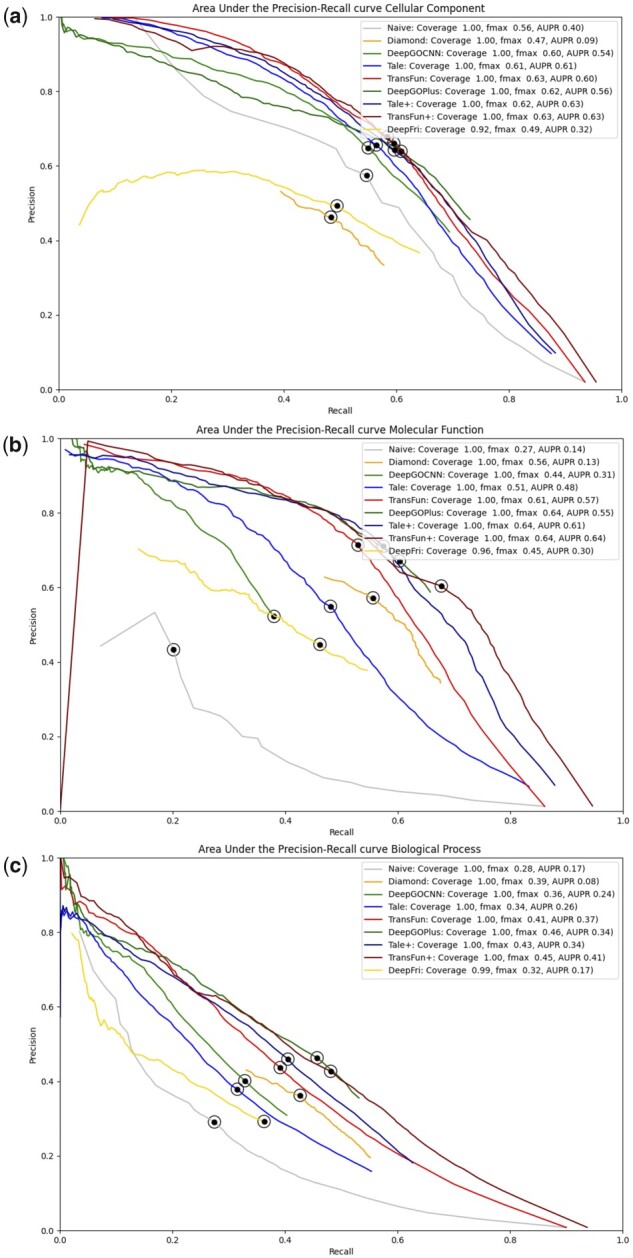
The precision-recall curves of the 9 methods on the new test dataset. The dot on the curves indicates where the maximum F score is achieved. The coverage is the percent proteins that a method makes predictions for.
Official websites use .gov
A
.gov website belongs to an official
government organization in the United States.
Secure .gov websites use HTTPS
A lock (
) or https:// means you've safely
connected to the .gov website. Share sensitive
information only on official, secure websites.
The precision-recall curves of the 9 methods on the new test dataset. The dot on the curves indicates where the maximum F score is achieved. The coverage is the percent proteins that a method makes predictions for.