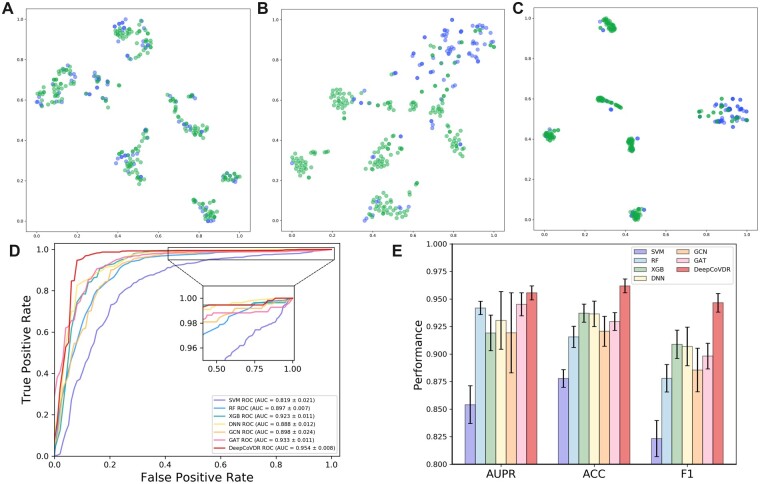
Figure 3.
Performance of DeepCoVDR in the classification setting. (a–c ) are visualization of the final embeddings of DeepCoVDR, and they are from epochs 20, 100, and 1000 respectively. The green and blue dots respectively represent the drugs with and without antiviral activity in our dataset. (d) shows the receiver operating characteristic (ROC) curve of the seven comparing methods. (e) shows the AUPR, ACC, and F1 scores of DeepCoVDR and baseline methods.

