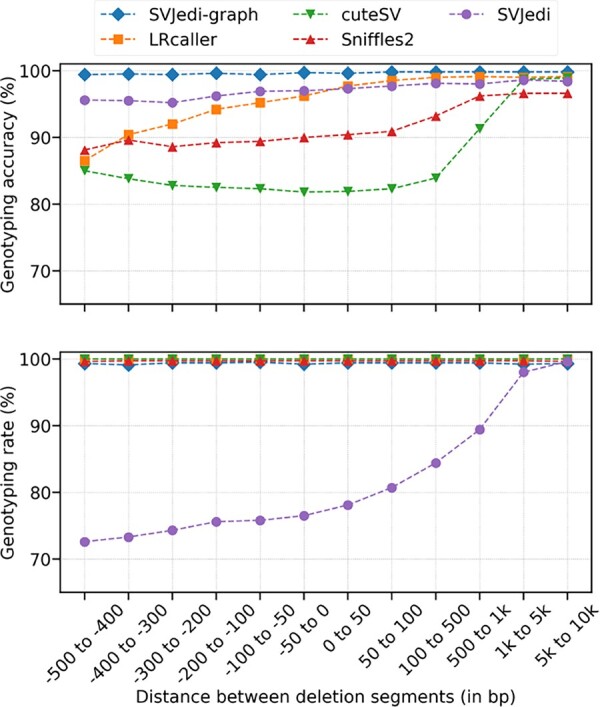
Figure 2.

Genotyping performances of long-read SV genotypers on the 12 simulated deletion datasets on human chromosome 1, with varying distances between pairs of consecutive deletions. The X axis represents the different simulated datasets ordered by increasing distance between pairs of consecutive deletion segments. Negative X values correspond to datasets with overlapping deletions.
