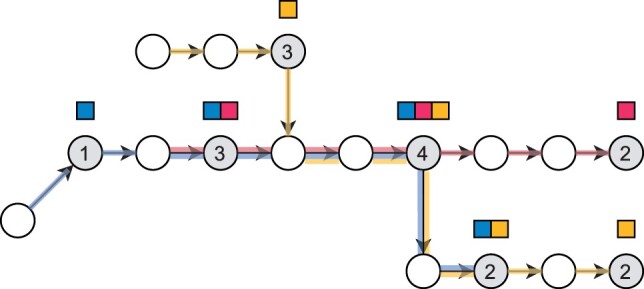
Figure 2.

Key k-mers in the de Bruijn graph. The blue, red, and yellow input strings are TGTTTGCTATCAC, TTGCTATCTGA, and ACGTACTATCACTT, respectively. The order k of the graph is 5. Node or edge labels are not drawn to reduce clutter. The key k-mers of the graph are shaded in gray and the numbers on the gray nodes indicate which one of the four cases in the definition of key k-mers that node falls into. The color sets of those nodes are shown as sets of squares above the nodes. The paths taken by the sequences corresponding to the colors are shown on the edges of the graph. The color set of a node that is not shaded in gray can be obtained by walking forward to the next gray node.
