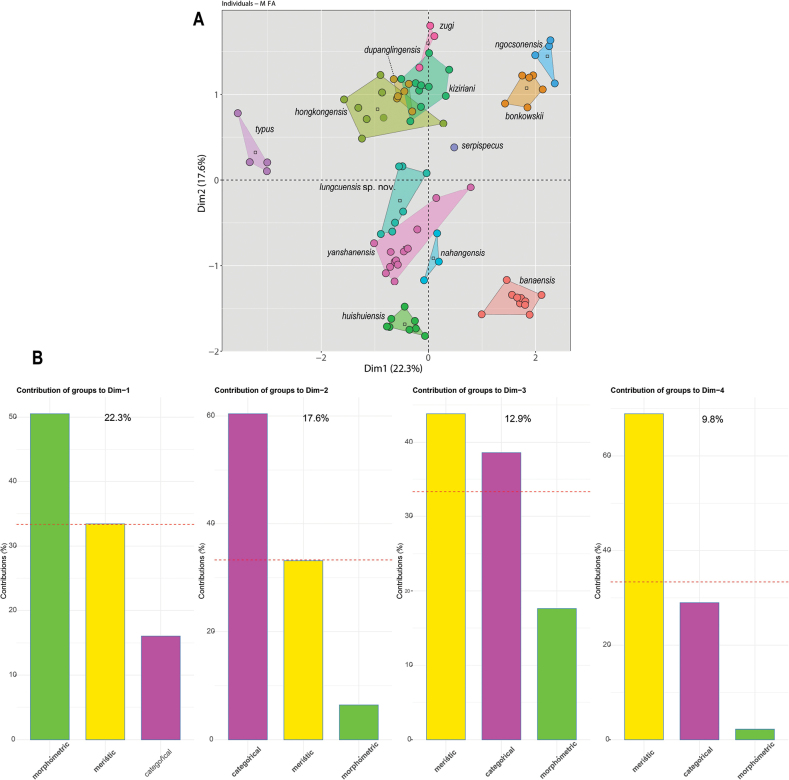
Figure 6.
AMFA scatter plot showing the morphospatial relationships among the Hemiphyllodactylus species of clade 6 B bar graphs showing the percent contribution of each data type to the overall variation in the data set for the first four dimensions. The dashed red line in the bar graphs indicates the expected average value if the contributions of each data type were equal.

