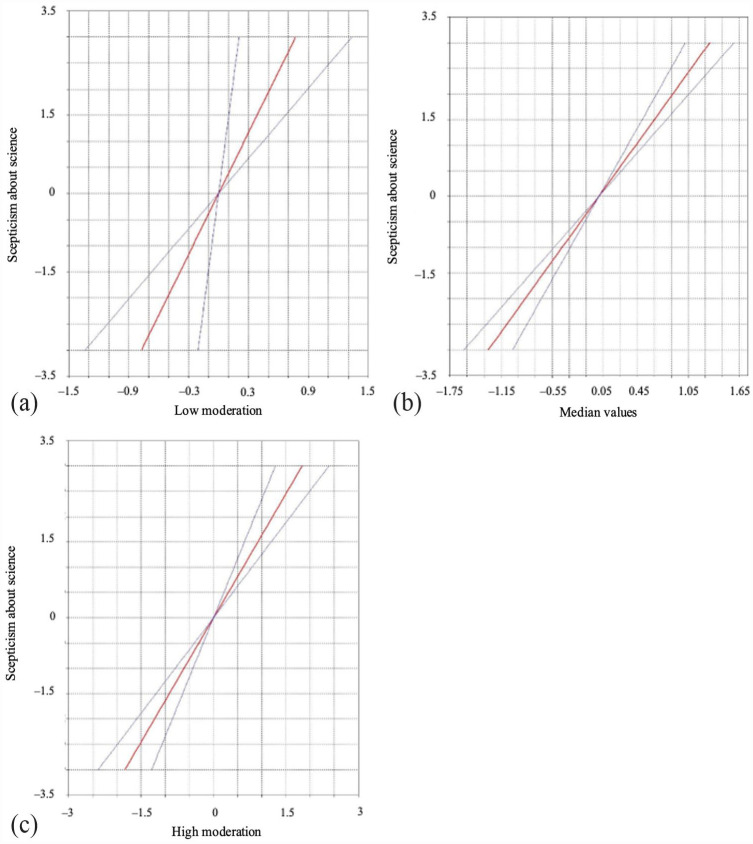
Figure 2.
Loop plots showing the slopes of unrealistic expectations about science on scepticism about science for low (less than −2.5 SD) (a), median (−2.5 to 2.5 SD) (b) and high (more than 2.5 SD) (c) values of the need for cognitive closure (NFC). Grey lines are confidence intervals and red lines are actual estimates.

