. 2023 Jun 13;15(25):10763–10775. doi: 10.1039/d3nr00076a

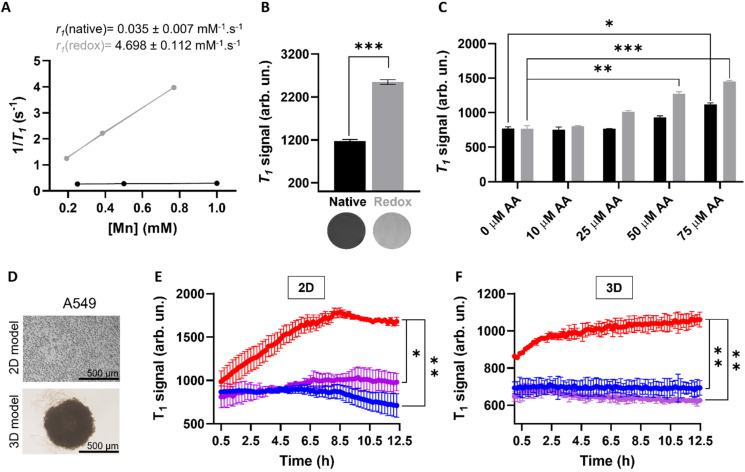
Fig. 6. (A) Relaxometric studies before (black) and after (grey) addition of AA (10 mM) and corresponding measured relaxivity values, at 1.5 T. (B) T1-Weighted MRI phantoms of NPs dispersions (bottom) and corresponding signal before (black) and after (grey) redox treatment, [Mn] = 700 μM, [AA] = 10 mM, at 3.0 T, ***p < 0.0001. (C) MR signals of NP dispersions in the presence of different concentrations of AA (0–75 μM) at pH = 7.4 (black) and 5.5 (grey), at 3.0 T, *p = 0.01, **p = 0.007 and ***p < 0.0001. (D) Representative images of 2D (top) and 3D (bottom) cell cultures used for in vitro imaging and cell viability studies. Scale bar represents 500 μm. (E) and (F), MR T1 signal evolution of (E) 2D and (F) 3D A549 cells treated with MnO2–Pt NPs (637 μM and 500 μM of Mn, respectively) over time, at 3.0 T. Blue: cells; purple: NPs in media, red: cells treated with NPs, *p = 0.013, **p < 0.005.

Fig. 6