Chronic kidney disease (CKD) remains an important driver of mortality in the United States.1 Traditional risk factors such as diabetes and hypertension can only partially explain the geographical variation in CKD mortality. There is increasing evidence that environmental and socioeconomic factors are key determinants of health outcomes in CKD. Recent findings suggest that air pollution, specifically particulate matter <2.5 microns (PM2.5), may be an important risk factor for CKD related morbidity and mortality.2 Further, social deprivation may increase susceptibility to PM2.5-mediated health effects3, but it is unknown whether this can be extrapolated to CKD. The objective of this study was to quantify the association between PM2.5 and CKD mortality by levels of social deprivation at the county level in the United States.
In this cross-sectional study, CKD mortality is defined as the number of people who died due to CKD. We linked 1999–2019 county-level age-adjusted CKD mortality data from the National Center for Health Statistics (NCHS) Multiple Cause of Death files (underlying cause of death International Classification of Diseases, 10th revision [ICD10]: N18.X) with the Social Deprivation Index (SDI) and chronic (1999–2019) PM2.5 exposures. ICD-10 codes have been shown to have a good accuracy in identifying patients with moderate to severe CKD.4 The SDI, a validated metric of socioeconomic status, grades counties from 1 (least socially deprived) to 100 (most socially deprived).5 We utilized the 2015 SDI which is generated by incorporating the following American Community Survey estimates (2011–2015) weighted by factor loadings: low income, low education, non-employment, no car ownership, crowded housing, renter-occupied housing, and single parent family home. 1999–2019 county-level PM2.5 estimates were generated by QGIS V3.22 utilizing modeled data by the Atmospheric Analysis Group.6 (Item S1) We grouped counties according to SDI quartile (1–25, 26–50, 51–75, and 76–100). We then used linear regression models to estimate the associations between PM2.5 and age-adjusted CKD mortality standardized to the 2000 US Census population (accounting for population change with time). Further, local spatial auto-correlations (Moran’s I) were modeled to identify statistically significant clusters of counties with high and low CKD mortality rates and PM2.5 exposures. Institutional Review Board approval and informed consent were not required since data used is publicly available and de-identified.
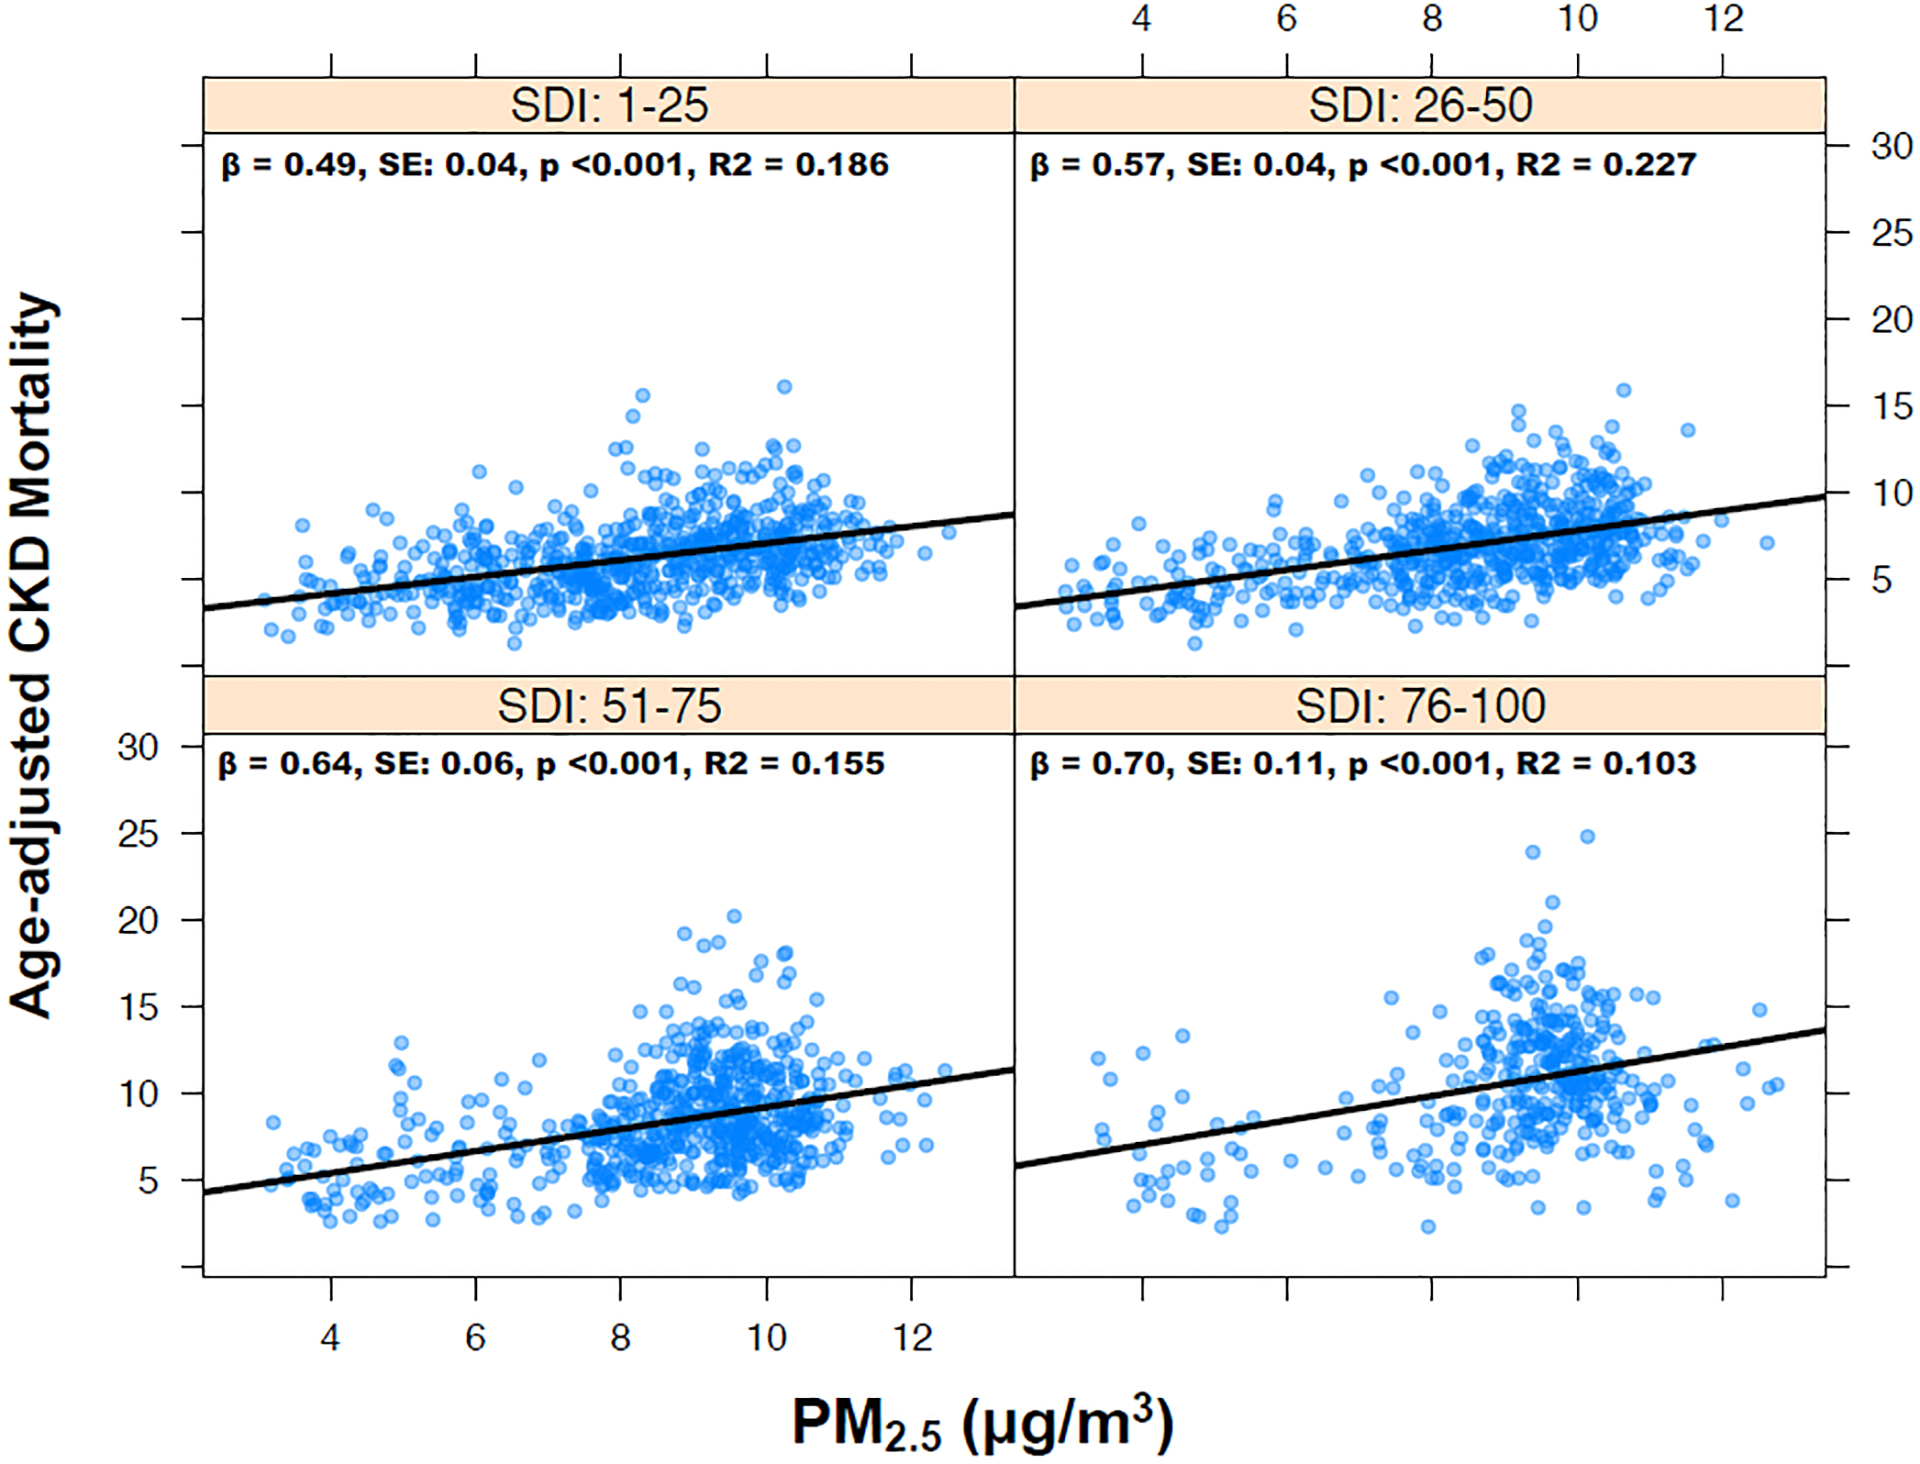
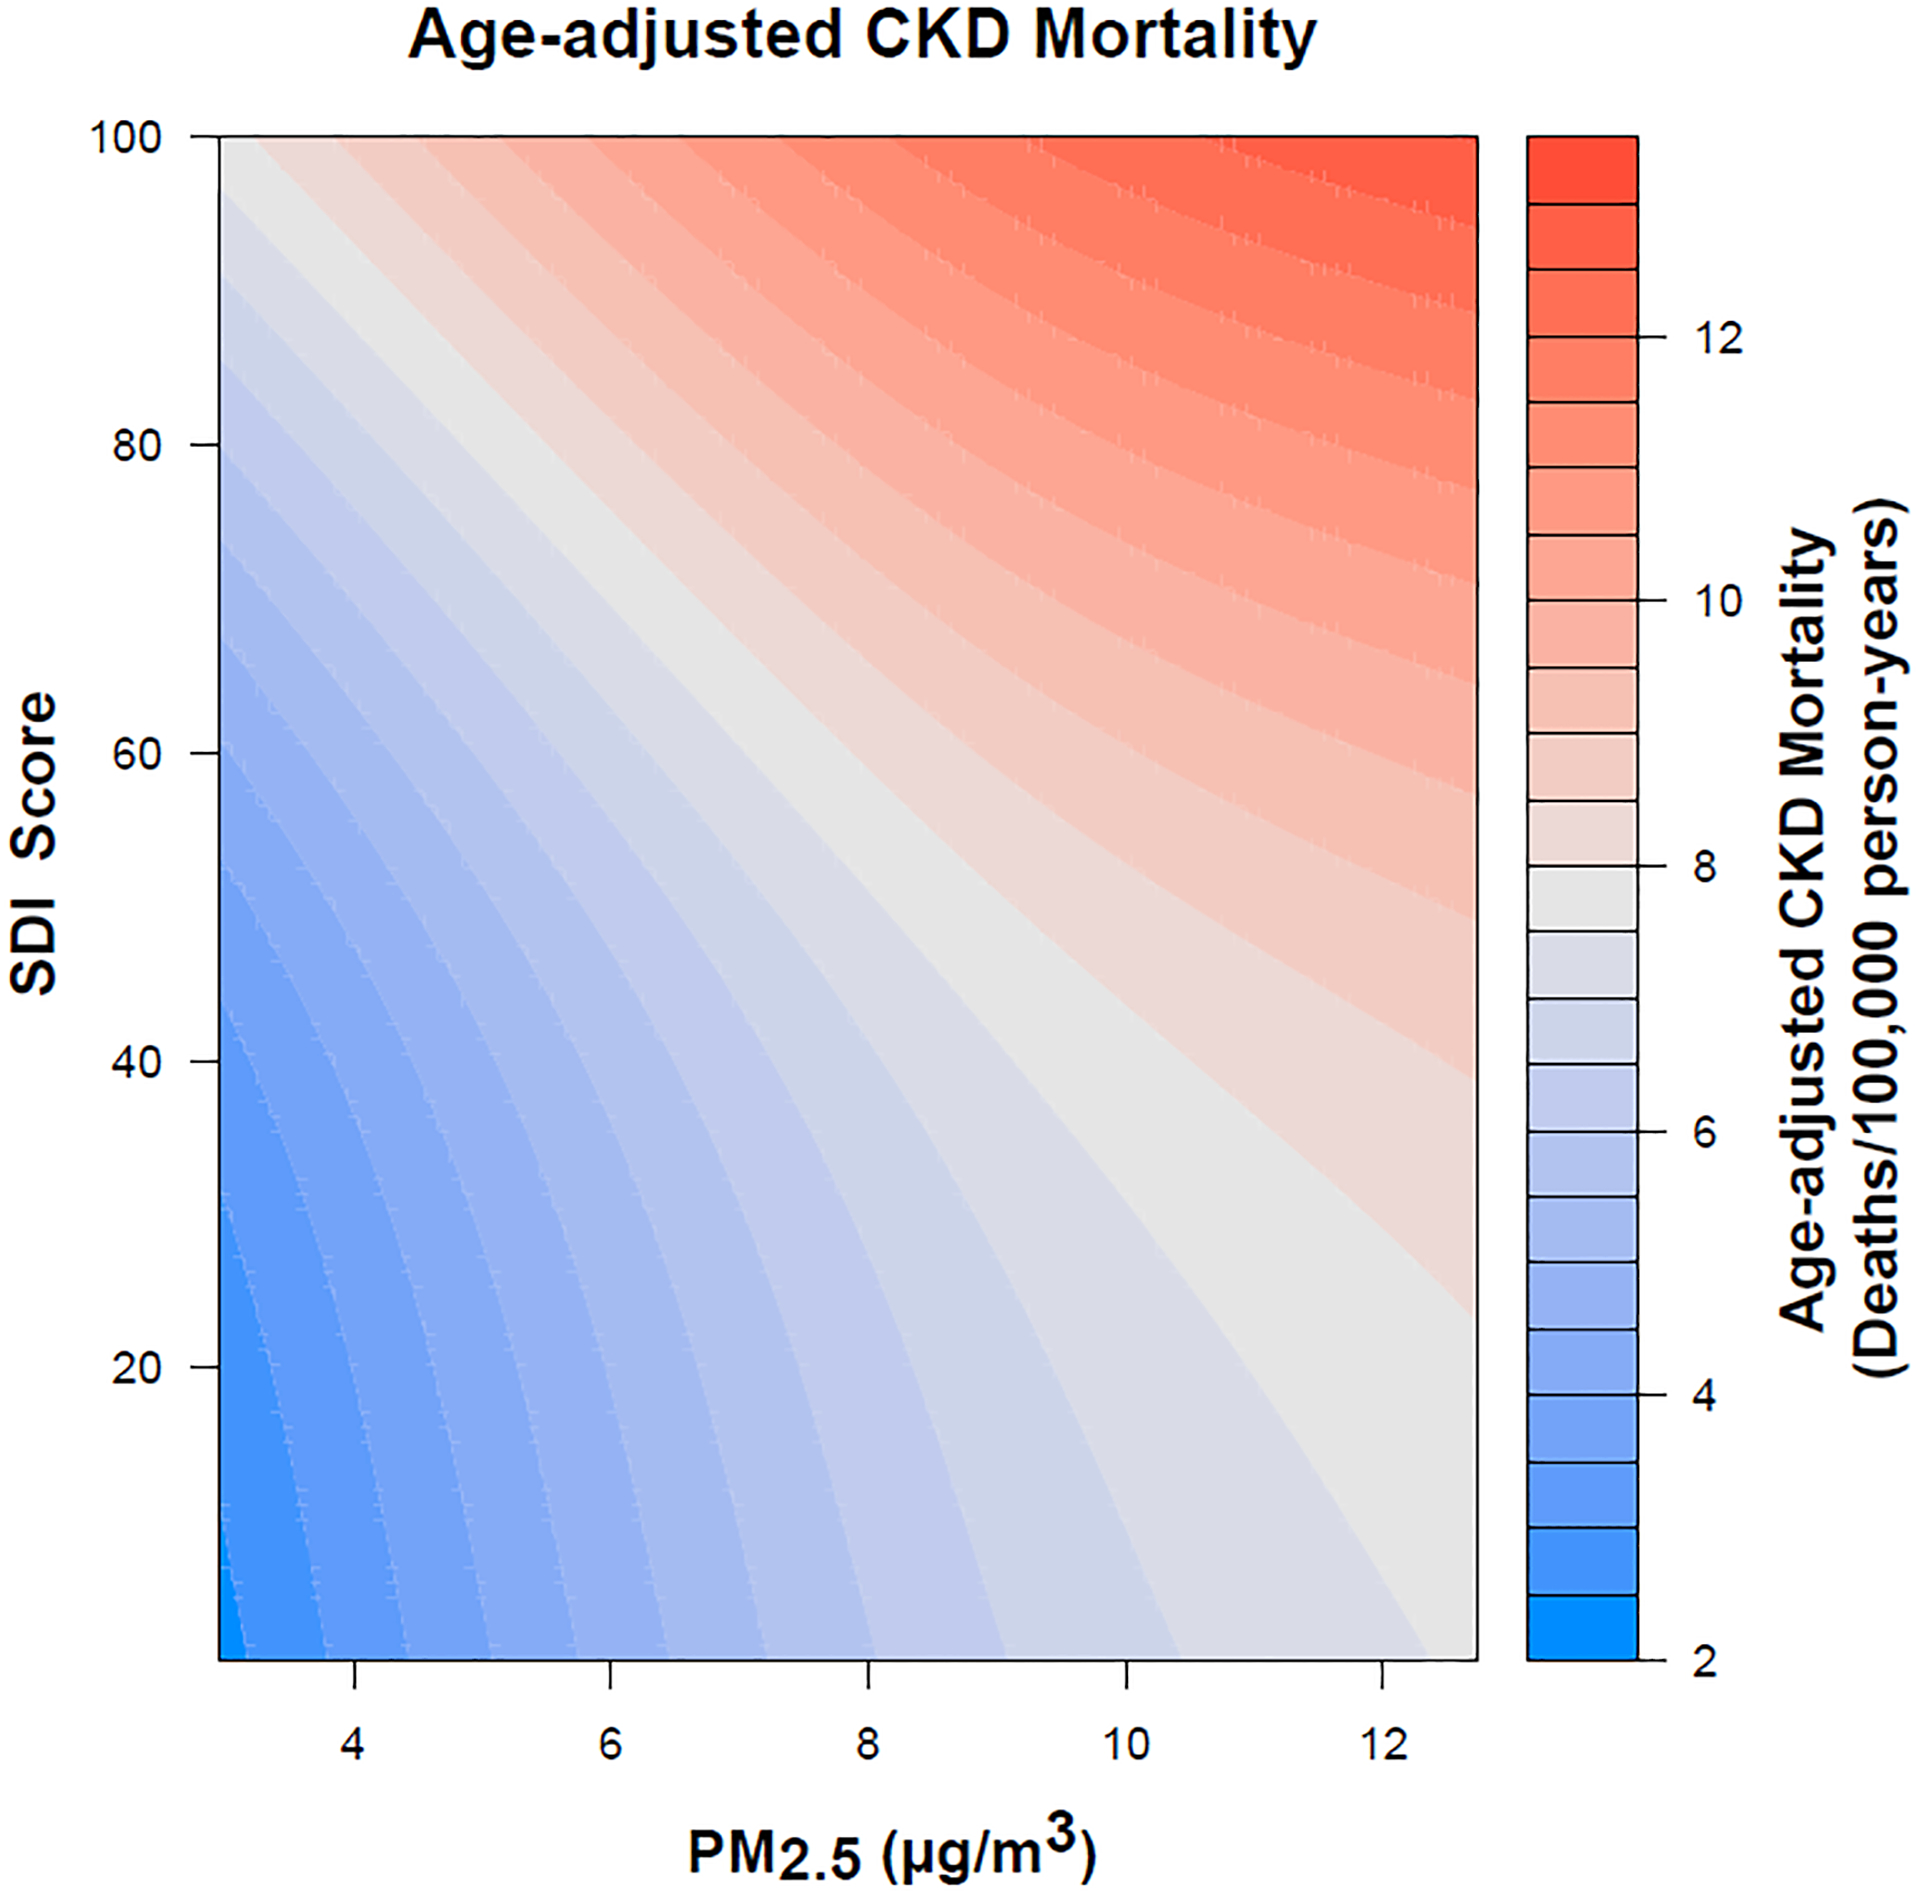
A total of 469,933 deaths due to CKD were analyzed across 2,304 U.S. counties with mean age-adjusted CKD mortality of 7.70 deaths/100,000 person-years. There was significant regional variation in age-adjusted CKD mortality and in PM2.5 (Figure S1). Counties with high social deprivation had higher PM2.5 exposure, albeit with significant overlap in PM2.5 levels between the groups (Figure S2). Univariate linear regression model showed that approximately 18% of intercountry variation in CKD mortality was explained by variation in PM2.5 alone, with an increased CKD mortality rate of 0.70 deaths/100,000 person-years for every 1 μg/m3 increase in PM2.5 exposure. The association was attenuated when adding SDI to the model, but both PM2.5 (β 0.57 [0.52–0.62], P<0.001) and SDI scores (β 0.05 [0.05–0.06], P<0.001) remained independently associated with age-adjusted CKD mortality (adjusted R2=0.37). Similar estimates were obtained using random effects stratified by US census region. The association between PM2.5 and CKD mortality was strongest among counties with highest SDI (β 0.70 [0.49–0.92]) compared with lowest SDI (β 0.49 [0.41–0.56]), P for interaction <0.001, Figure 1. CKD mortality across the spectrum of PM2.5 and SDI interitions is shown in Figure 2. Positive and negative spatial autocorrelations were noted in PM2.5 and CKD mortality (Figure S3).
Figure 1:

Association between PM2.5 and age-adjusted chronic kidney disease (CKD) mortality (rate per 100,000) by social deprivation index (SDI).
Figure 2:

Association between particulate matter < 2.5 microns (PM2.5) and chronic kidney disease (CKD) mortality with social deprivation index (SDI) interaction; highest (red) and lowest (blue) CKD mortality rates are achieved when PM2.5 and SDI are simultaneously high or low, respectively.
In this analysis of roughly half a million CKD deaths, we illustrate that PM2.5 is associated with age-adjusted CKD mortality even after adjusting for social deprivation. We further show that the association between PM2.5 and CKD is accentuated in counties that are most socially vulnerable, and that 37% of intercountry variation of CKD mortality can be explained by PM2.5 and SDI alone.
This analysis highlights the important contributions of social and environmental drivers of CKD. Air pollutants can increase risk of CKD via multiple mechanisms, including inflammation, oxidative stress, thrombosis, and elevations in blood pressure and glycemia7–9. We additionally demonstrate that socially deprived areas may be disproportionately impacted by air pollution, which is similar to what has been observed for cardiovascular disease3, extrapolating both social deprivation-related susceptibility and vulnerability effects to air pollution to CKD. The mechanisms driving this disproportionate increase in PM2.5 related CKD mortality among socially-deprived individuals may include healthcare access, behavioral risk factors, work-related exposures, as well as the prevalence of other comorbidities which might signal increased susceptibility to the effects of air pollution.10
A main limitation of this study is that the accuracy of CKD mortality defined by ICD-10 codes has not been validated. Further, our analysis is limited by using population-level data which may not account for all confounders, using modeled environmental exposures, temporal heterogeneity of data, and possible misclassification of cause of death. We tried to minimize these limitations by using large scale age-adjusted mortality and adjusting for SDI, a conglomerate of socio-economic variables.
Our findings call for increased recognition of geographical disparities in CKD mortality and their socio-environmental drivers. Interventions curbing PM2.5 pollutions may be most impactful to reduce CKD mortality in socio-economically deprived areas.
Supplementary Material
Support:
This work was partly funded by the National Institute on Minority Health and Health Disparities Award # P50MD017351.
Footnotes
Financial Disclosure: The authors declare that they have no relevant financial interests.
References:
- 1.Chronic Kidney Disease in the United States, 2021. Published July 8, 2021. Accessed May 31, 2022. https://www.cdc.gov/kidneydisease/publications-resources/ckd-national-facts.html
- 2.Jung J, Park JY, Kim YC, et al. Effects of air pollution on mortality of patients with chronic kidney disease: A large observational cohort study. Science of The Total Environment. 2021;786:147471. doi: 10.1016/j.scitotenv.2021.147471 [DOI] [PubMed] [Google Scholar]
- 3.Bevan GH, Freedman DA, Lee EK, Rajagopalan S, Al-Kindi SG. Association between ambient air pollution and county-level cardiovascular mortality in the United States by social deprivation index. Am Heart J. 2021;235:125–131. doi: 10.1016/j.ahj.2021.02.005 [DOI] [PubMed] [Google Scholar]
- 4.Paik JM, Patorno E, Zhuo M, et al. Accuracy of identifying diagnosis of moderate to severe chronic kidney disease in administrative claims data. Pharmacoepidemiology and Drug Safety. 2022;31(4):467–475. doi: 10.1002/pds.5398 [DOI] [PMC free article] [PubMed] [Google Scholar]
- 5.Butler DC, Petterson S, Phillips RL, Bazemore AW. Measures of social deprivation that predict health care access and need within a rational area of primary care service delivery. Health Serv Res. 2013;48(2 Pt 1):539–559. doi: 10.1111/j.1475-6773.2012.01449.x [DOI] [PMC free article] [PubMed] [Google Scholar]
- 6.Hammer MS, van Donkelaar A, Li C, et al. Global Estimates and Long-Term Trends of Fine Particulate Matter Concentrations (1998–2018). Environ Sci Technol. 2020;54(13):7879–7890. doi: 10.1021/acs.est.0c01764 [DOI] [PubMed] [Google Scholar]
- 7.Ye Z, Li X, Han Y, Wu Y, Fang Y. Association of long-term exposure to PM2.5 with hypertension and diabetes among the middle-aged and elderly people in Chinese mainland: a spatial study. BMC Public Health. 2022;22(1):569. doi: 10.1186/s12889-022-12984-6 [DOI] [PMC free article] [PubMed] [Google Scholar]
- 8.Kuźma Ł, Małyszko J, Bachórzewska-Gajewska H, Kralisz P, Dobrzycki S. Exposure to air pollution and renal function. Sci Rep. 2021;11(1):11419. doi: 10.1038/s41598-021-91000-0 [DOI] [PMC free article] [PubMed] [Google Scholar]
- 9.Eze IC, Hemkens LG, Bucher HC, et al. Association between Ambient Air Pollution and Diabetes Mellitus in Europe and North America: Systematic Review and Meta-Analysis. Environmental Health Perspectives. 2015;123(5):381–389. doi: 10.1289/ehp.1307823 [DOI] [PMC free article] [PubMed] [Google Scholar]
- 10.Makri A, Stilianakis NI. Vulnerability to air pollution health effects. International Journal of Hygiene and Environmental Health. 2008;211(3):326–336. doi: 10.1016/j.ijheh.2007.06.005 [DOI] [PubMed] [Google Scholar]
Associated Data
This section collects any data citations, data availability statements, or supplementary materials included in this article.


