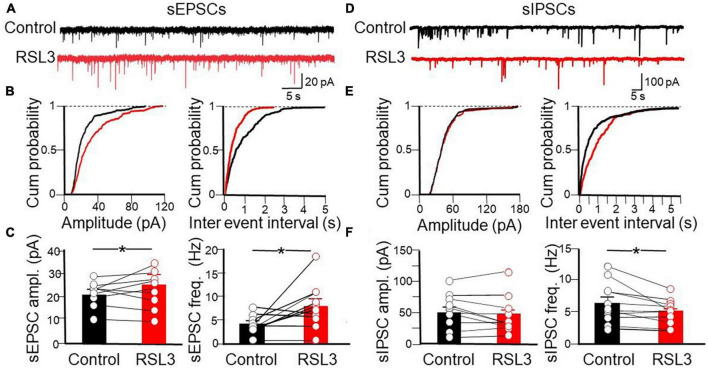
FIGURE 4.
Disinhibitory effect of RSL3 on layer IV spiny neurons. (A) Sample traces of sEPSCs recorded (in picrotoxin) from layer IV spiny neurons in the absence (black) or in the presence (red) of RSL3 (5 μM). (B) Cumulative probability plots of amplitude (left) and inter-event intervals (right) obtained in the absence (black, n = 10/5 animals) or in the presence (red, n = 10/5 animals) of RSL3. Significant increases of amplitude (p < 0.0001, K-S test) and frequency (p < 0.0001, K-S test) of sEPSCs were found in RSL3-treated slices, as compared to controls. (C) Each column represents the mean amplitude (left) and frequency (right) of sEPSCs recorded in the absence (black) or in the presence (red) of RSL3. Bars represent the SEM. Open circles refer to individual values. *p < 0.05 (paired Student t-test). (D) Sample traces of sIPSCs recorded, in the presence of CNQX, from layer IV spiny neurons in the absence (black) or in the presence (red) of RSL3 (5 μM). (E) Cumulative probability plots of amplitude (left) and inter-event intervals (right) of sIPSCs obtained in the absence (black, n = 11/4 animals) or in the presence (red, n = 11/4 animals) of RSL3. A significant reduction in frequency (p < 0.0001, K-S test) but not in amplitude of sIPSCs was found between controls and RSL3-treated slices. (F) Each column represents the mean amplitude (left) and frequency (right) of sEPSCs recorded in the absence (black) or in the presence (red) of RSL3. Bars represent the SEM. Open circles refer to individual values. *p < 0.05 (paired Student t-test).

