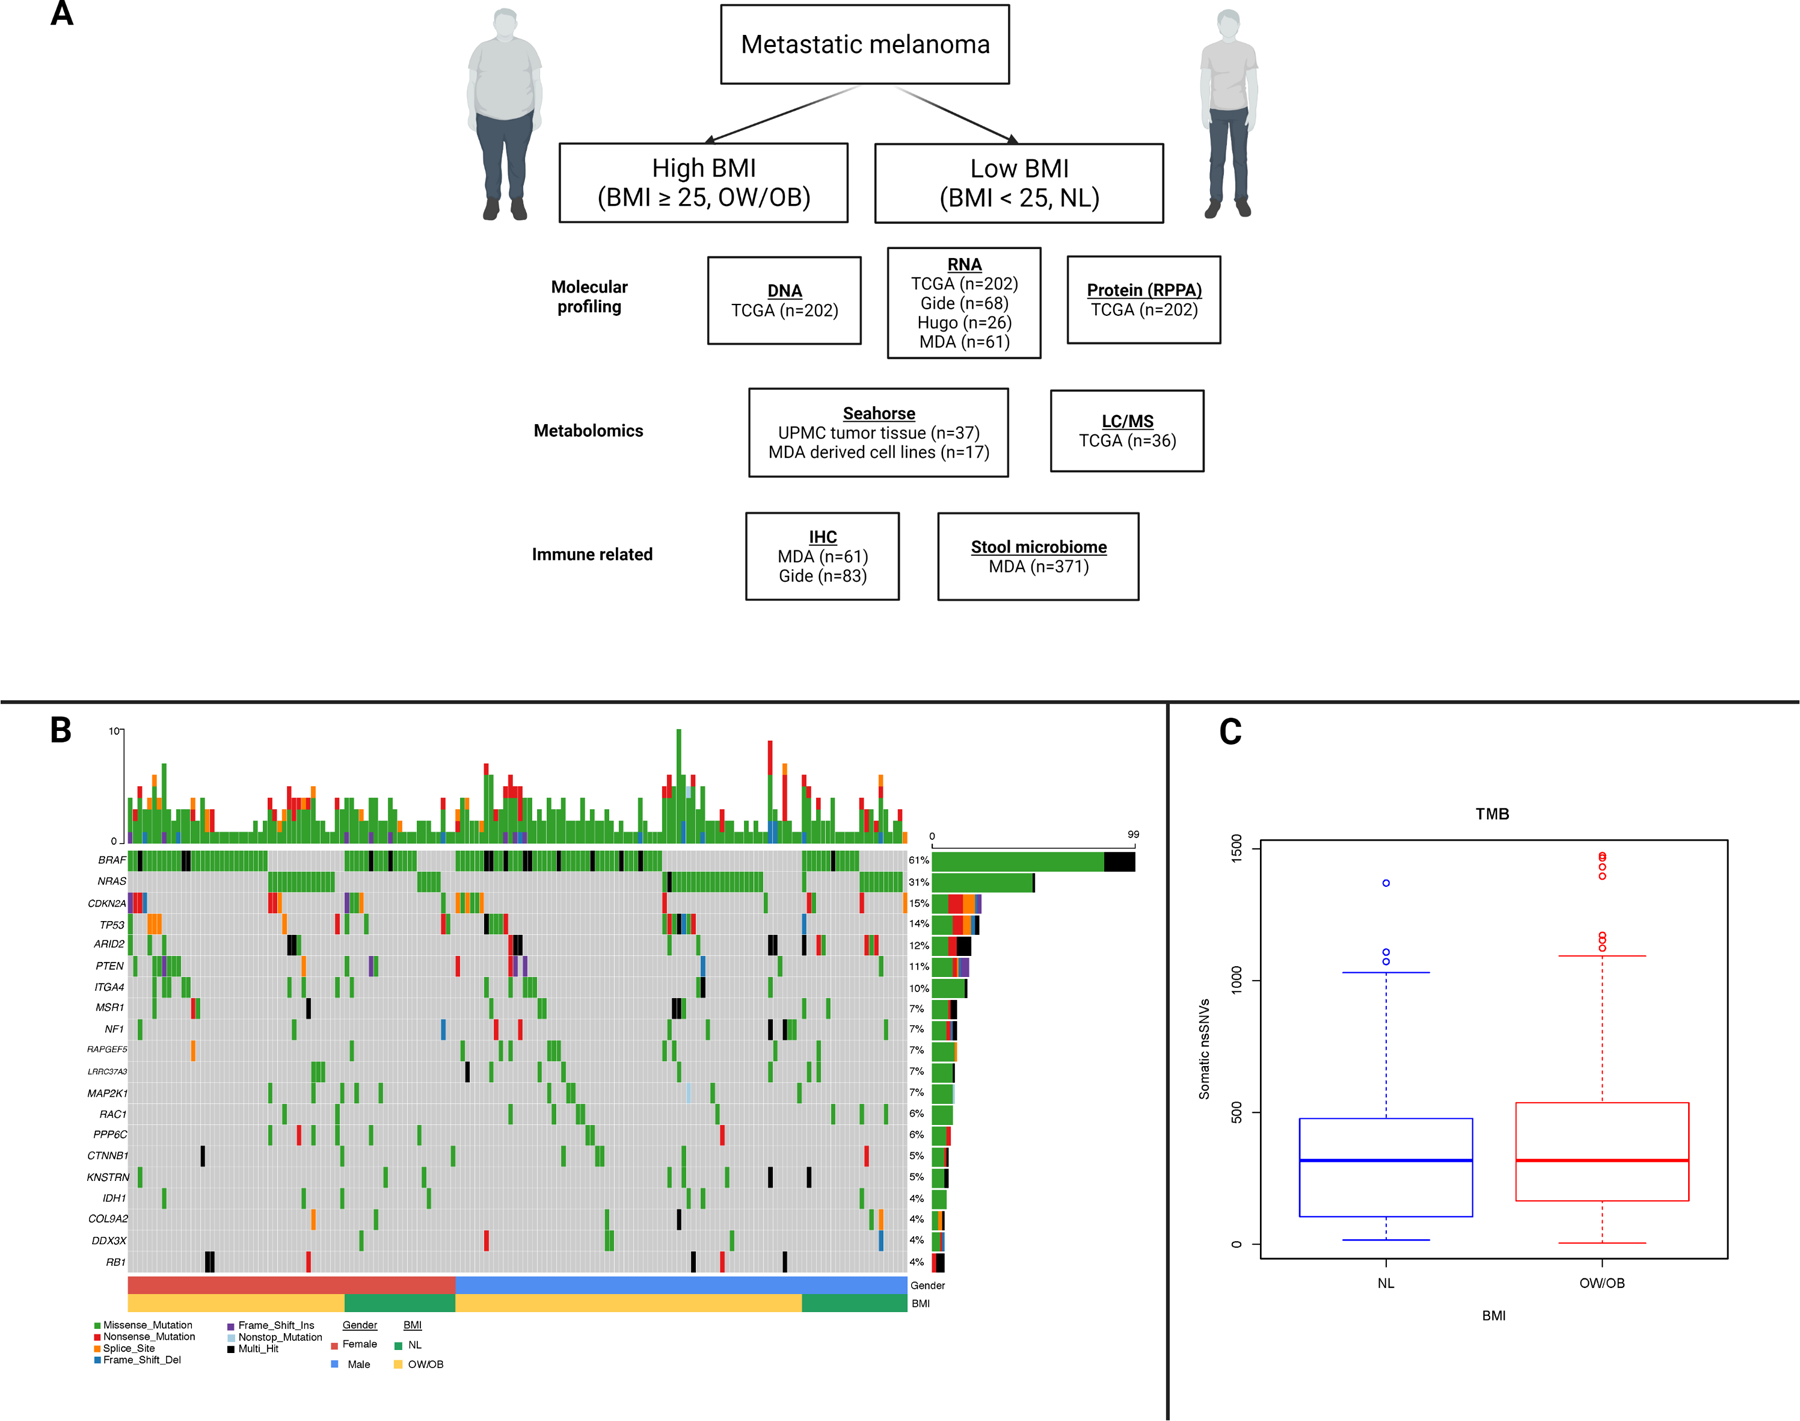
Figure 1:

Overview of studies performed by cohort and somatic DNA studies by body mass index.
A. Overview of analyses performed by cohort. BMI = body mass index, OW = overweight, OB = obese, NL = normal, TCGA = The Cancer Genome Atlas, MDA = MD Anderson Cancer Center, RPPA = reverse phase protein array, LC/MS = liquid chromatography/mass spectrometry, IHC = immunohistochemistry.
B. Oncoplot depicting somatic DNA alterations in regionally metastatic melanoma from The Cancer Genome Atlas (TCGA) cohort by BMI and sex. At the top of the figure, the vertical bar from 1–10 shows the number of alterations by individual patient. In the second to bottom row, blue indicates males and red indicates females. In the bottom row, green indicates normal (NL) BMI and yellow indicates overweight/obese (OW/OB) BMI. In the middle rows, the numbers to the left are the frequency of alterations in each gene listed to the right. For these middle rows, green is a missense mutation, red is a nonsense mutation, purple is a frameshift insertion, blue is a frameshift deletion, orange is a splice site alteration, and black is multi-hit.
C. Tumor mutation burden by body mass index (BMI) in regionally metastatic melanoma from TCGA cohort.
