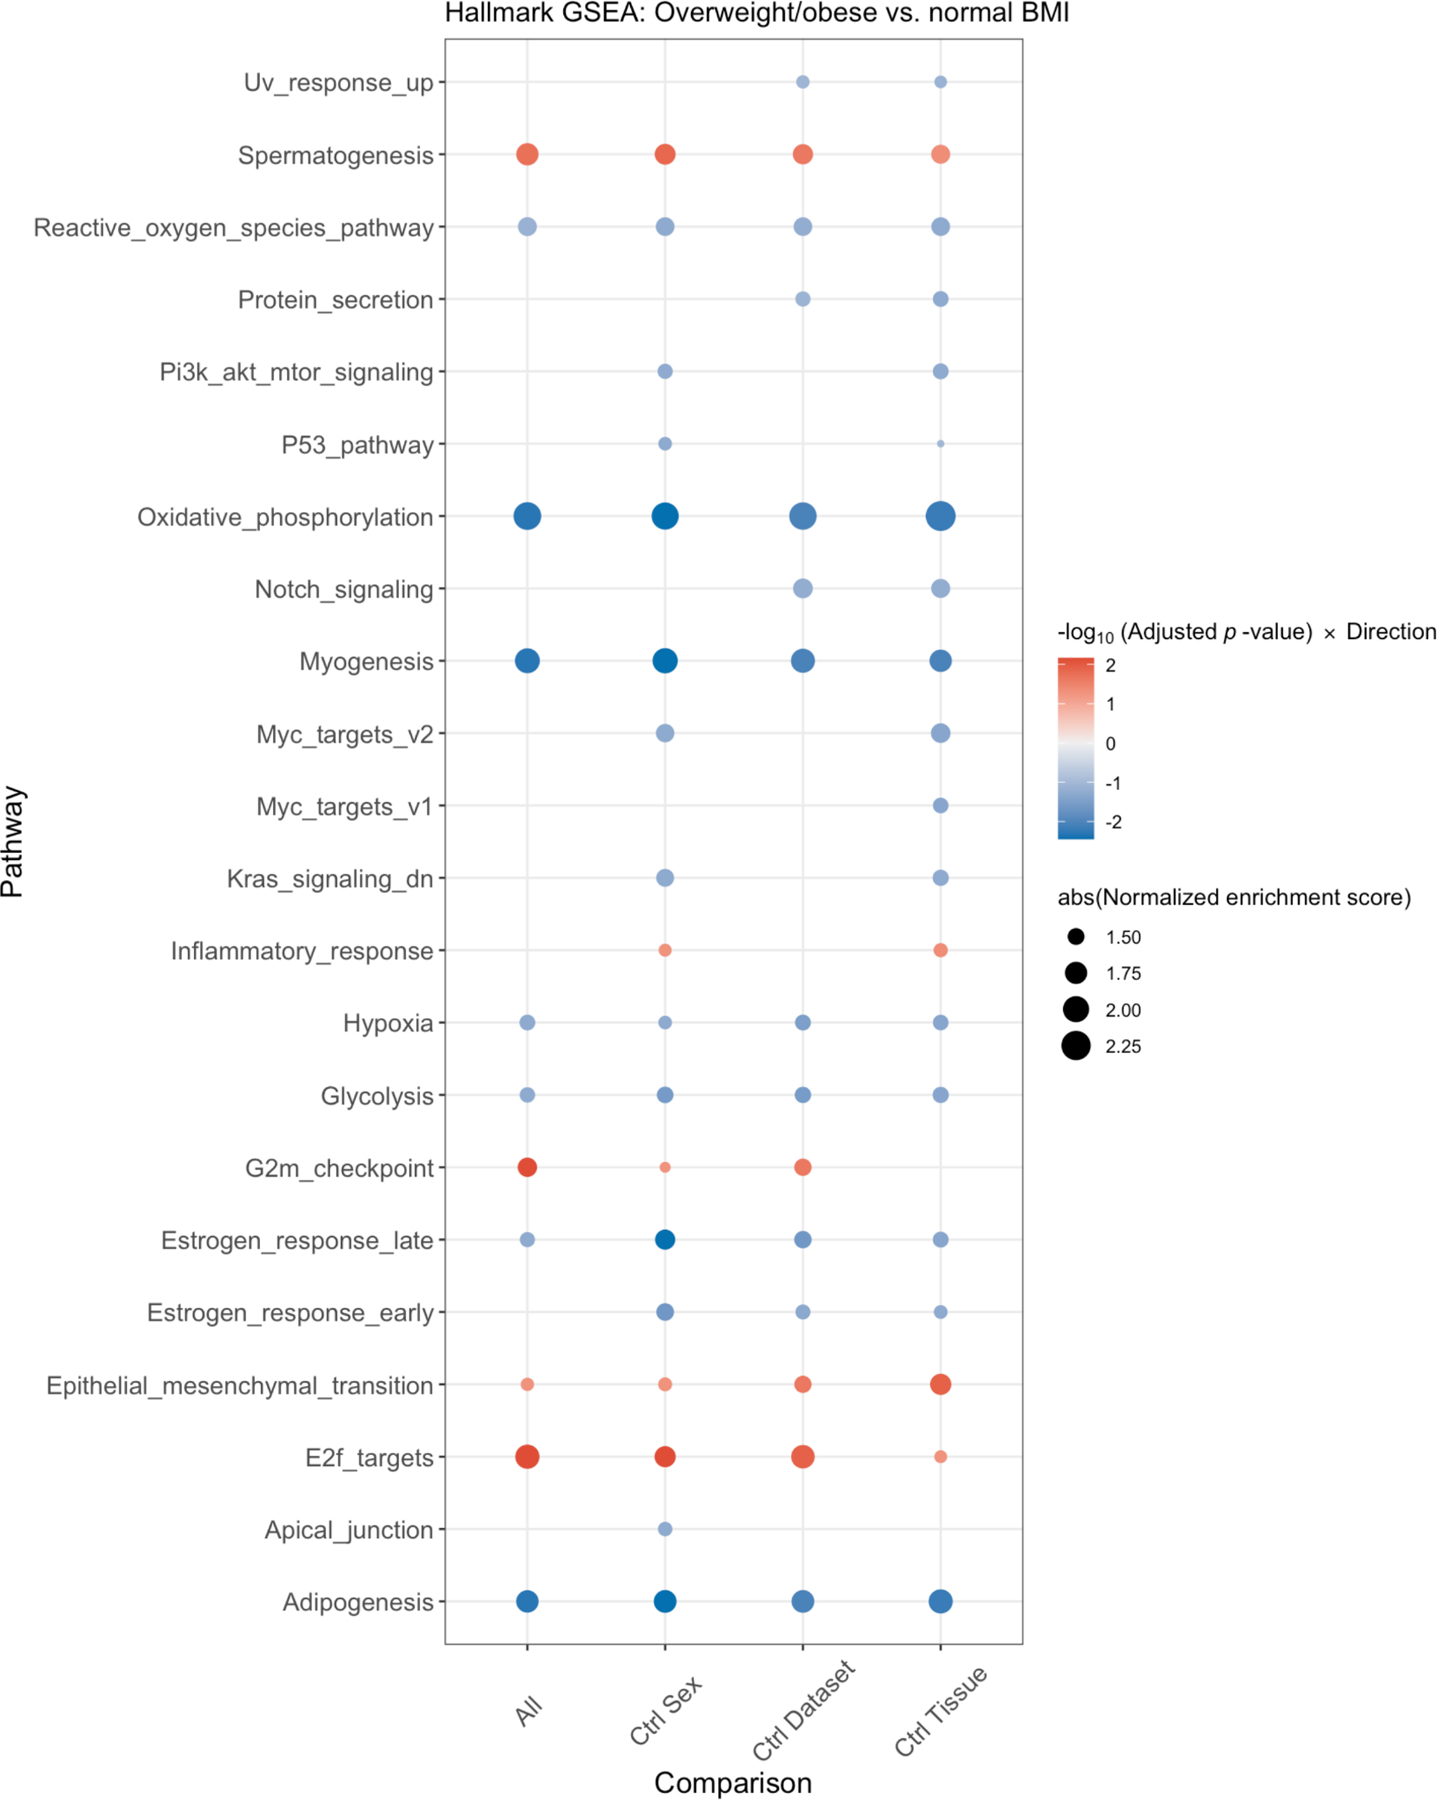
Figure 2:

Integrated gene set enrichment analysis by body mass index (BMI). This figure presents a dotplot of genes differentially up- or downregulated in OW/OB patients versus NL BMI patients. Red indicates upregulation in OW/OB verse NL. The far left column is all patients, and then, an analysis controlling for sex, cohort, and tissue site is shown in the 3 columns to the right.
