
Figure 4:
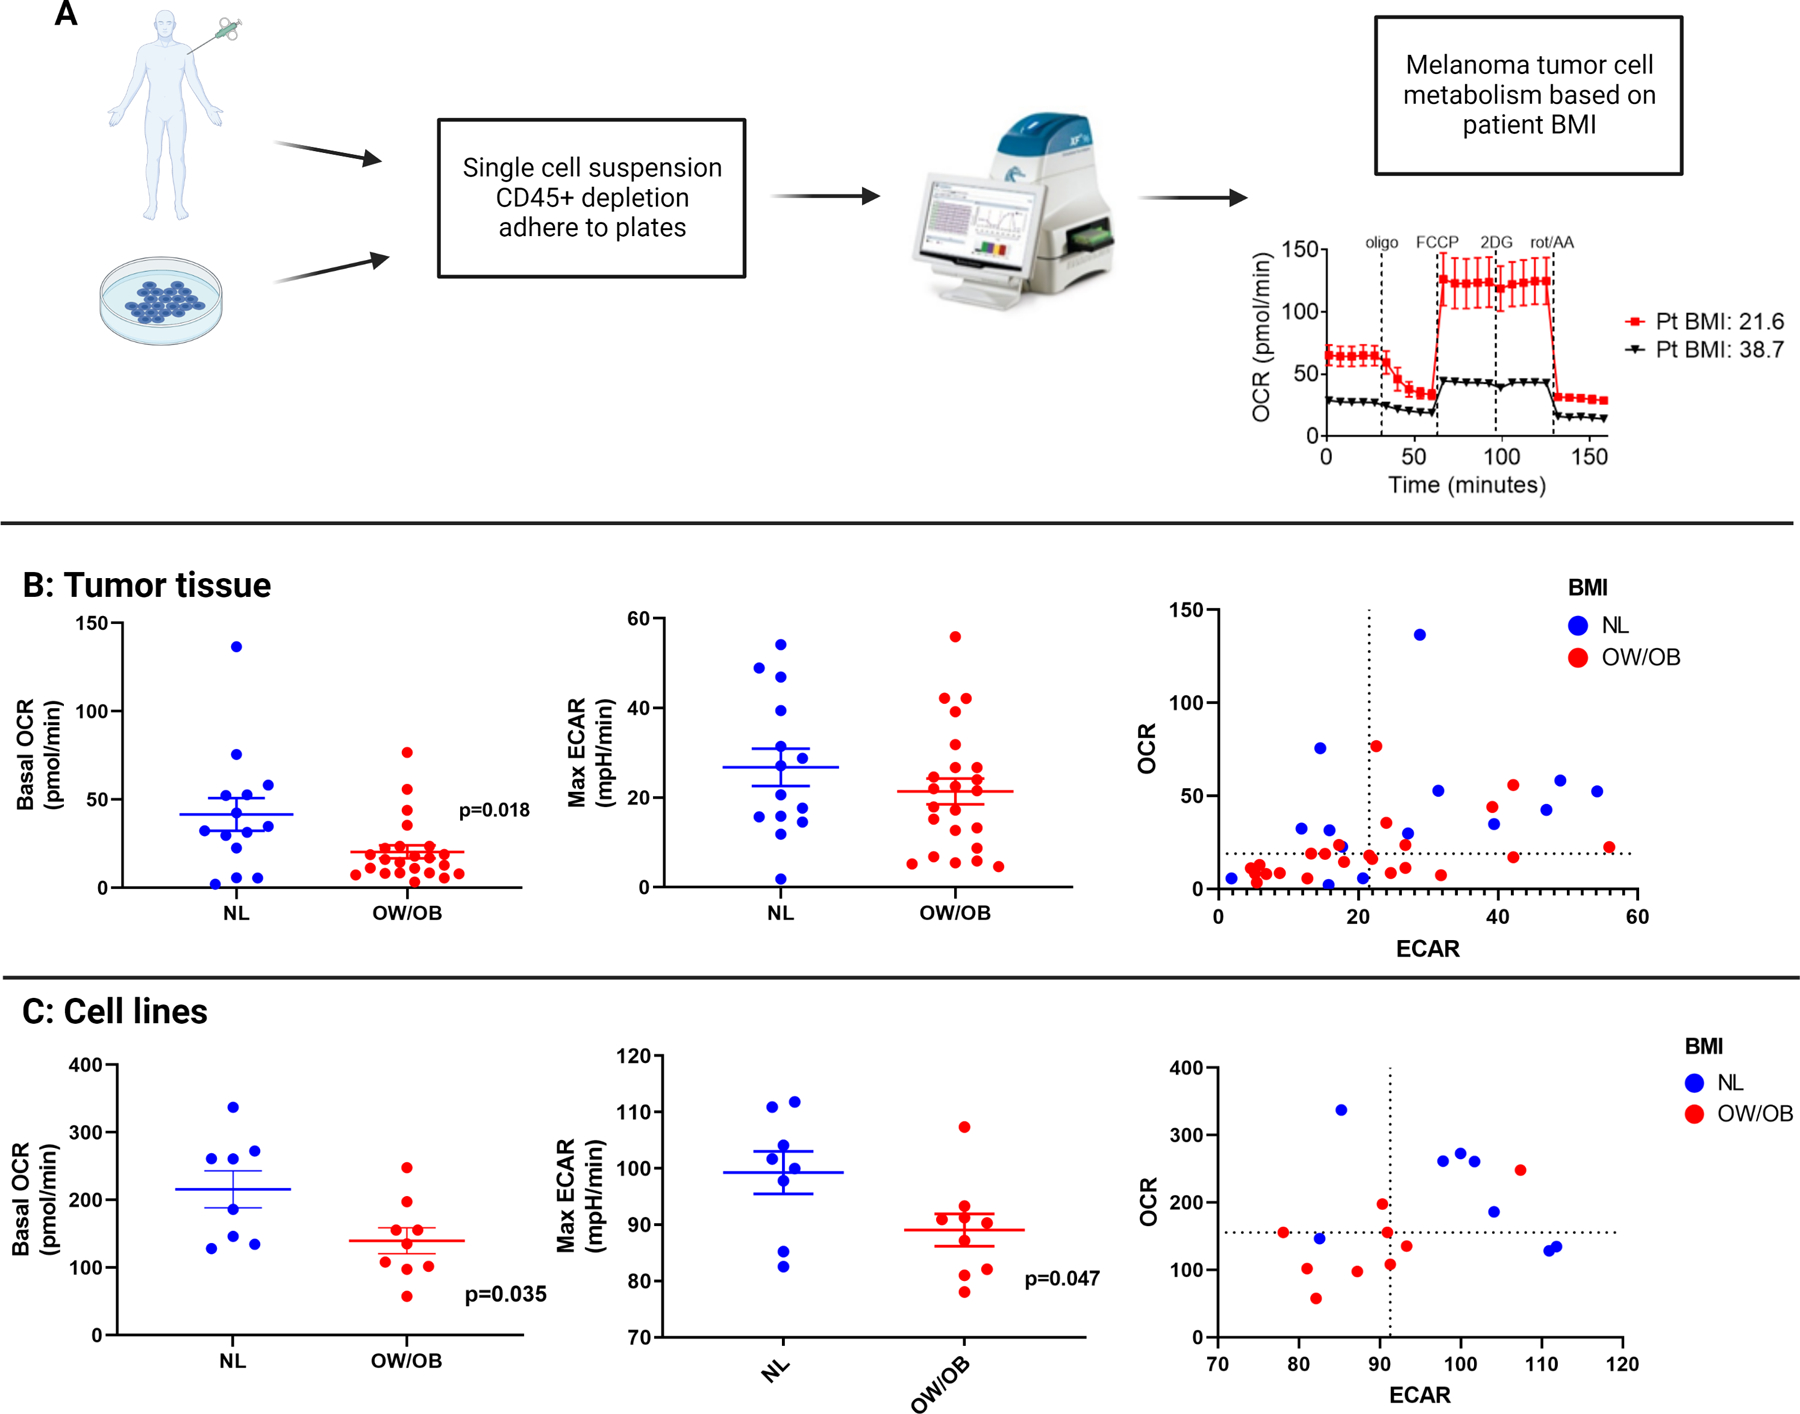
Direct measurement of mitochondrial metabolism in tumor tissue specimens and patient-derived melanoma cell lines by BMI.
A. Overview of the process to measure mitochondrial metabolism by Seahorse Extracellular Flux Assay from either tumor tissue biopsy or patient-derived melanoma cell lines. OCR = oxygen consumption rate, ECAR = extracellular acidification rate.
B. The first figure shows OCR measurements and the second figure shows ECAR measurements by BMI in tumor tissue of patients with metastatic melanoma. The third figure in Panel B shows one dot per patient reflecting ECAR measurements on the X axis and OCR measurements on the Y axis. Lines represent mean +/− SEM; each dot represents a single tumor. Dashed lines represent the median value in the third figure.
C. The first figure in Panel C shows OCR measurements and the second figure shows ECAR measurements by BMI in patient-derived melanoma cell lines. The third figure in Panel shows one dot per unique cell line representing ECAR measurements on the X axis and OCR measurements on the Y axis. Lines represent mean +/− SEM; each dot represents a single tumor. Dashed lines represent the median value in the third figure