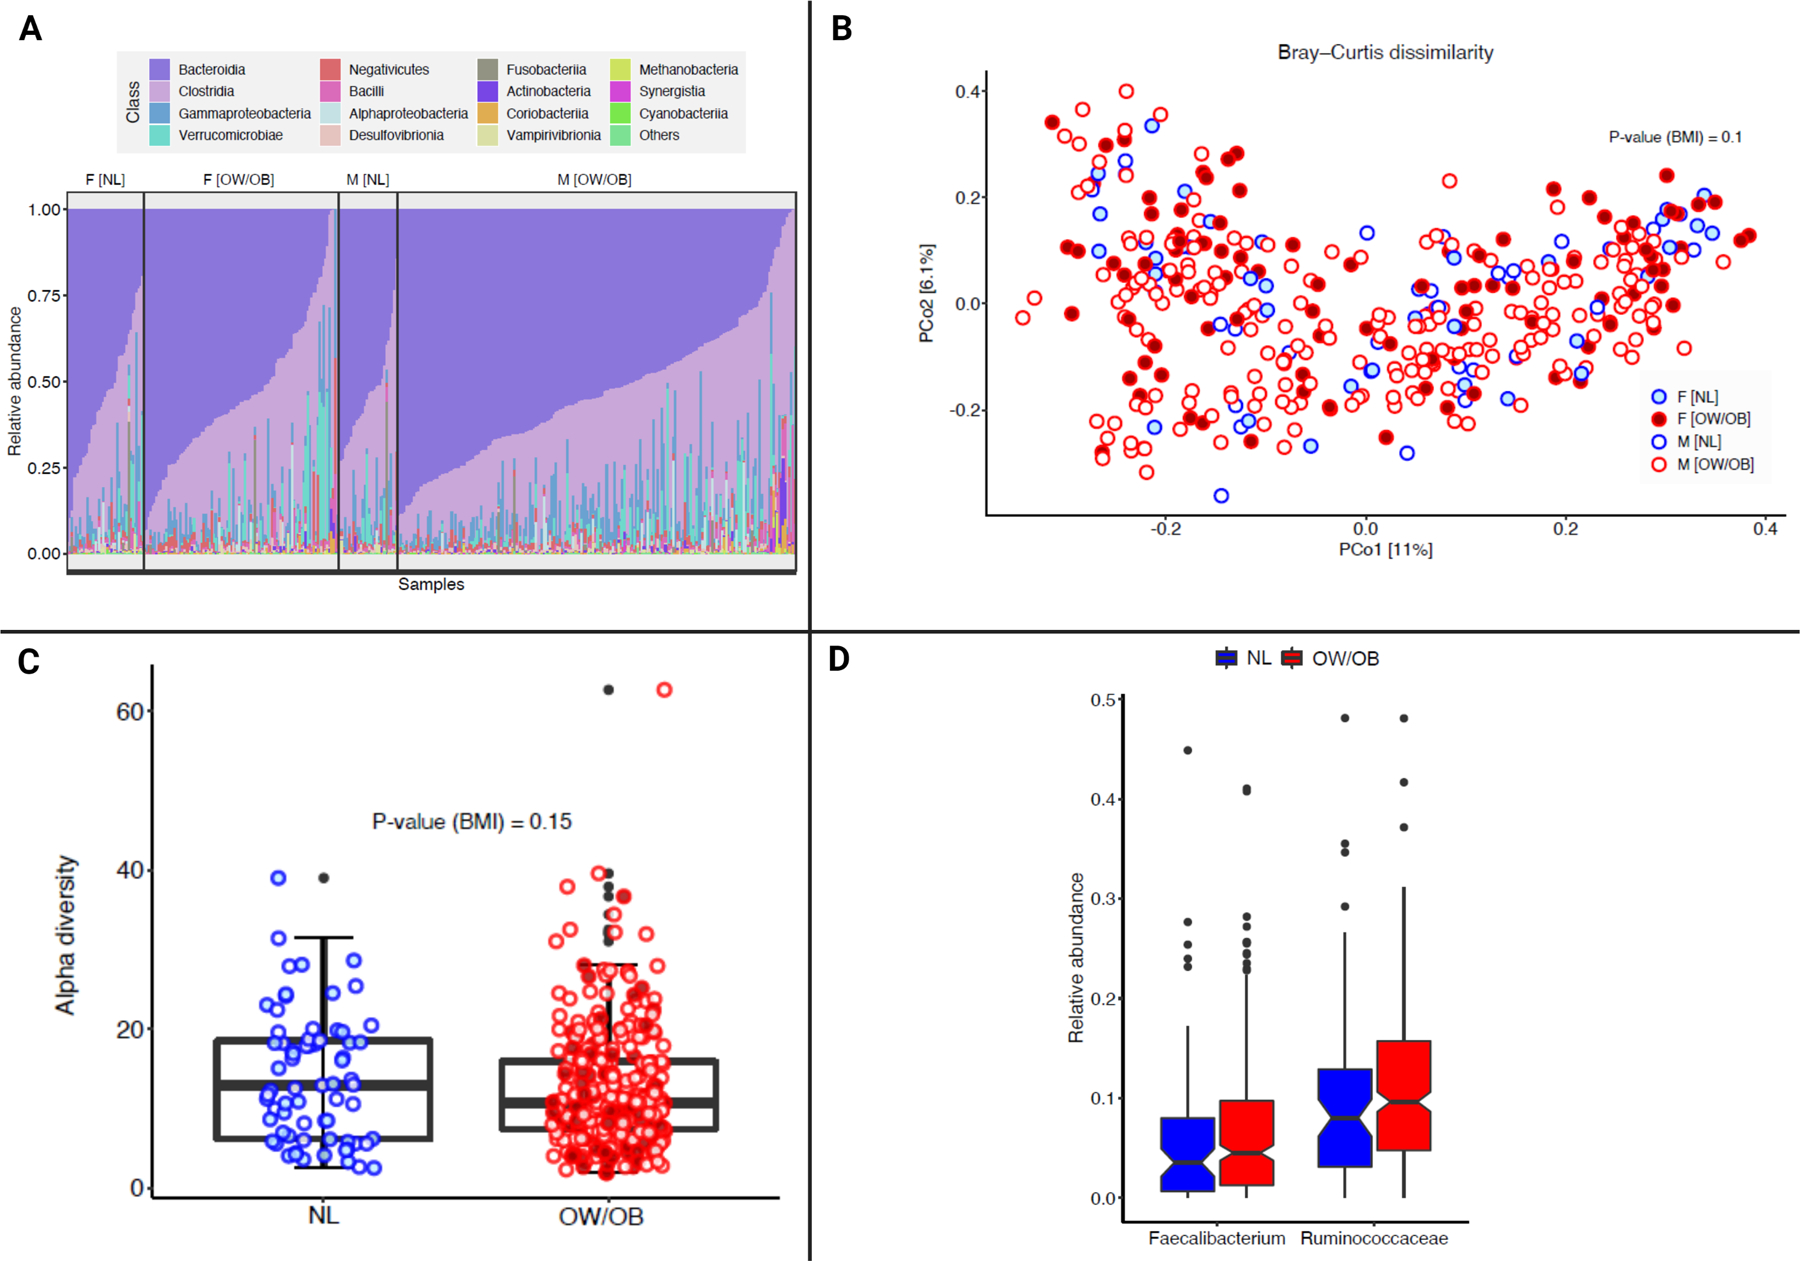
Figure 5:

Fecal microbiome diversity and composition by body mass index (BMI).
A. The composition plot depicts the microbiome samples at the class level in the taxonomy, where samples are ordered by BMI and sex in the MD Anderson melanoma microbiome cohort (n=371).
B. Beta-diversity analysis based on Bray-Curtis dissimilarity represents microbiome samples with metastatic melanoma in terms of the two top principal components (explaining around 17% of variance) obtained from the principal coordinate analysis. Red dots are from overweight/obese (OW/OB) BMI patients, and blue dots are from normal (NL) BMI patients. Shading inside the dots indicates the female gender. PERMANOVA analysis analyzes the significant (p-value reported) impact of BMI on beta-diversity after controlling for the batch effect of age and sex.
C. Inverse Simpson alpha diversity scores of the fecal microbiome by BMI in patients with metastatic melanoma. Box plot represents the median bar with the box bounding the IQR and whiskers the most extreme points within 1.5 x IQR. The red dots represent OW/OB patients and the blue dots represent NL patients by BMI.
D. Relative abundance of Faecalibacterium and Ruminococcaceae by BMI. The blue columns are NL BMI patients, and the red columns are OW/OB BMI patients.
