
FIG. 1 |.
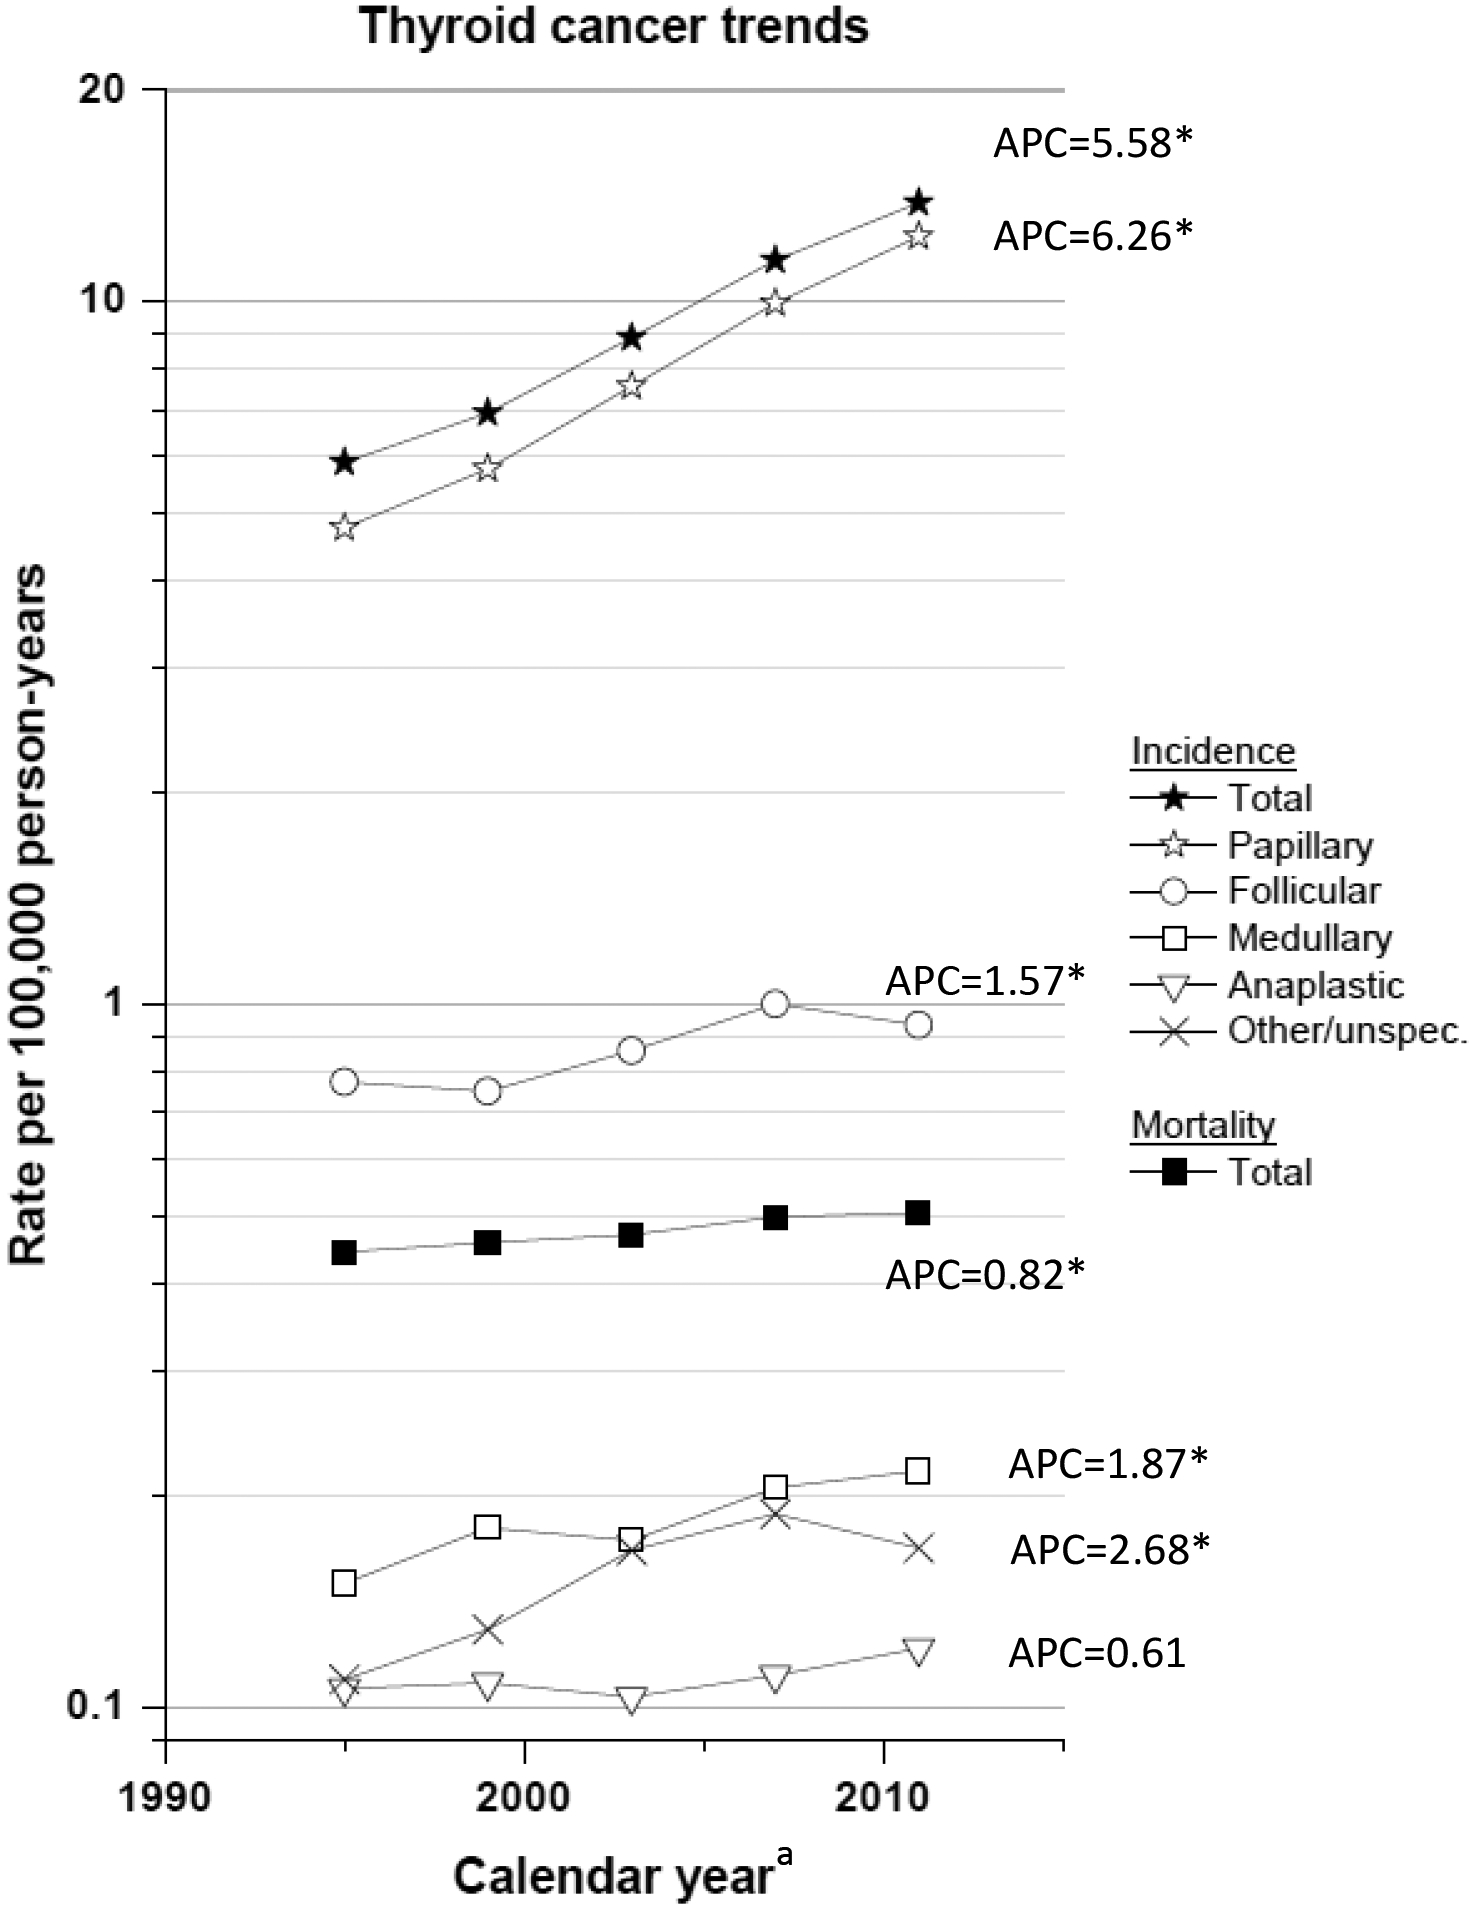
Trends in total and histology-specific thyroid cancer incidence (SEER 13) and total thyroid cancer mortality (USA) from 1993–2012. Rates are age-adjusted (2000 US standard population) and each point represents 4 years. Incidence data are from the SEER 13 areas (San Francisco, Connecticut, Detroit, Hawaii, Iowa, New Mexico, Seattle, Utah, Atlanta, Rural Georgia, Los Angeles, San Jose-Monterey and the Alaska Native Registry); thyroid cancer cases are restricted to those microscopically confirmed and exclude cases identified only by autopsy or death certificates. Mortality data are from the US Mortality Files, National Center for Health Statistics, Center for Disease Control and Prevention. Annual percent change (APC) based on rates age-adjusted to the 2000 US standard population (19 age groups – Census P25–1130). *APC is significantly different from zero (P <0.05).