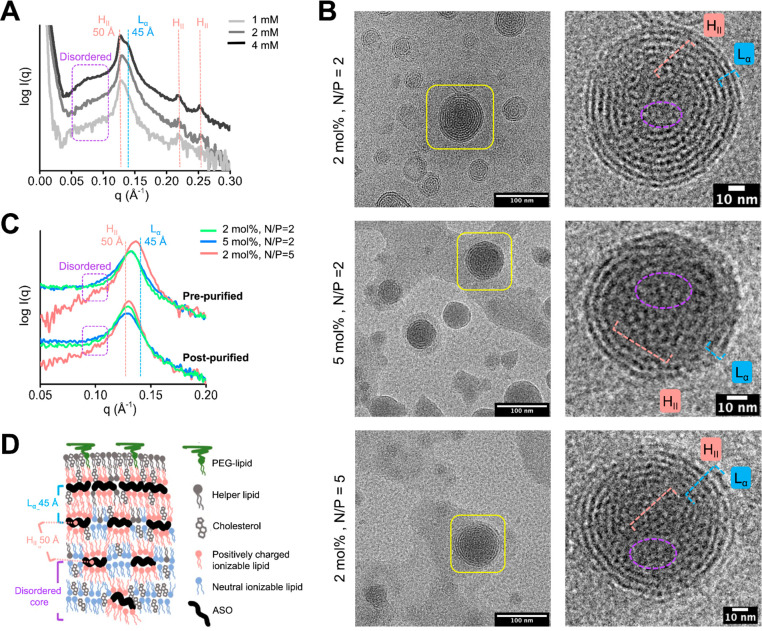
Figure 1.
Structure comparison of LNPs with different compositions and buffer conditions. (A) SAXS profile of prepurified LNPs analyzed at different total lipid concentrations. The 1 mM sample was diluted 1:1 in PBS from the 2 mM sample. The position of HII phase peaks at q, q*√3, and q*√4 with the spacing d = 50 Å and the Lα phase peak with d = 45 Å are highlighted with red and blue dashed lines, respectively. SAXS signal of the disordered phase with a larger d spacing is highlighted with a violet box. (B) Cryo-EM images of prepurified LNPs prepared with 1 mM total lipids. Representative particles in each formulation are magnified to highlight ASO-lipid compartmentalization in the HII and Lα phases, which are indicated by red and blue scales, respectively. The violet circle highlights the disordered phase in the core of the particle. (C) SAXS profiles of prepurified (top) and postpurified (bottom) LNPs prepared with different compositions and a total lipid concentration of 1 mM. The positions of SAXS signatures of the HII and Lα phases, with the approximate d spacing of 50 and 45 Å, are highlighted with red and blue dashed lines, respectively. (D) Proposed distribution of HII, Lα, and disordered phases in the LNP core with highlighted d spacing in-between ASO-lipid multilayers (blue spacer) and ASO-lipid compartments (red spacer).

