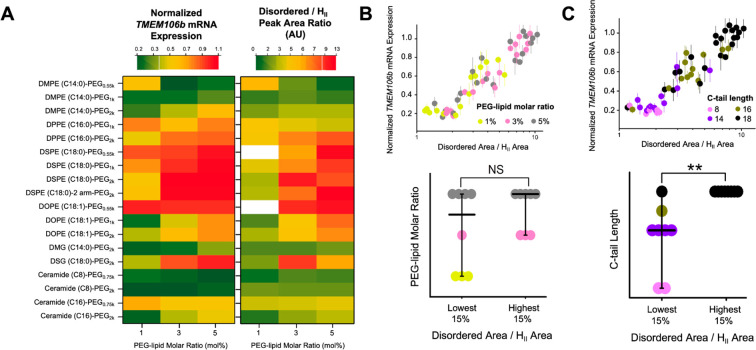
Figure 6.
PEG-lipid properties impact internal structure and cellular knockdown efficacy of ASO-LNPs. (A) The 54 formulations are presented using color-coded heat maps to rank-order them based on the relative mRNA expression (left panel) and disordered/HII peak area ratios (right panel). Two unstable formulations without the primary HII peaks were excluded from the SAXS model fitting and are indicated in white in the SAXS ratio heat map. (B, C) Correlations among disordered/HII peak area ratio, PEG-lipid carbon tail length, PEG-lipid molar ratio, and relative mRNA expression across the screening library. **p < 0.05, ***p < 0.001, ****p < 0.0001, NS: nonsignificant, as analyzed by two-tailed t tests. All cellular efficacy and DLS data were obtained from our previous study.17

