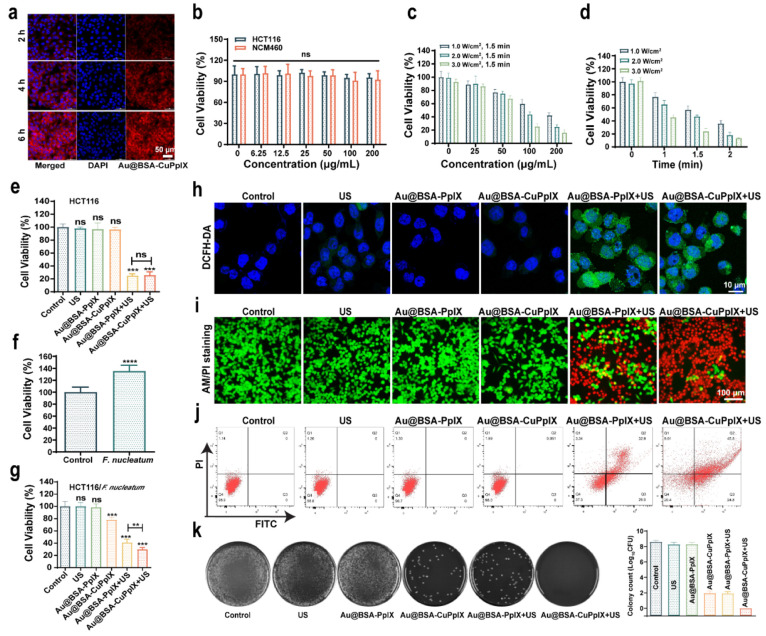
Figure 3.
In vitro anticancer and antibacterial activities. (a) CLSM pictures of HCT116 cells after being co-incubated with Au@BSA-CuPpIX for 2, 4, and 6 h. Red fluorescence: Cy5.5-labeled Au@BSA-CuPpIX (100 μg/mL), blue fluorescence: DAPI. (b) The viabilities of HCT116 and NCM460 cells after incubation with Au@BSA-CuPpIX for 24 h at different concentrations (0, 6.25, 12.5, 25, 50, 100, and 200 μg/mL). (c) Cell viabilities of HCT116 cells treated with Au@BSA-CuPpIX at varied concentrations (0, 25, 50, 100, and 200 μg/mL) using varying power densities (1.0, 2.0, and 3.0 W/cm2) of US irradiation. (d) The viability of HCT116 cells under varying US irradiation durations (0, 1, 1.5, 2 min) or different power densities (1.0, 2.0, 3.0 W/cm2) while being treated by Au@BSA-CuPpIX at a concentration of 100 μg/mL. (e) The viability of HCT116 cells evaluated after various treatments (PBS, Au@BSA-PpIX, Au@BSA-CuPpIX, US, Au@BSA-PpIX+US, Au@BSA-CuPpIX+US). (f) The cell viabilities of HCT116 cells after coculture with F. nucleatum (1:1000) after 48 h. (g) Cocultured with F. nucleatum after 48 h, the cell viability of HCT116 cells after different treatments. (h) Images of HCT116 cells obtained through CLSM after various treatments stained with DCFH-DA. (i) Images captured through inverted fluorescence microscopy images of HCT116 cells that have been stained by Calcein-AM and PI dyes in different treatments (green fluorescence: Calcein-AM representing live cells, red fluorescence: PI representing dead cells). (j) Cocultured with F. nucleatum after 48 h, flow cytometric analysis of HCT116 cells after various treatments. (k) Plate photographs of F. nucleatum forming a colony after different treatments. The corresponding colony count results of different treatment groups.

