Figure 4.
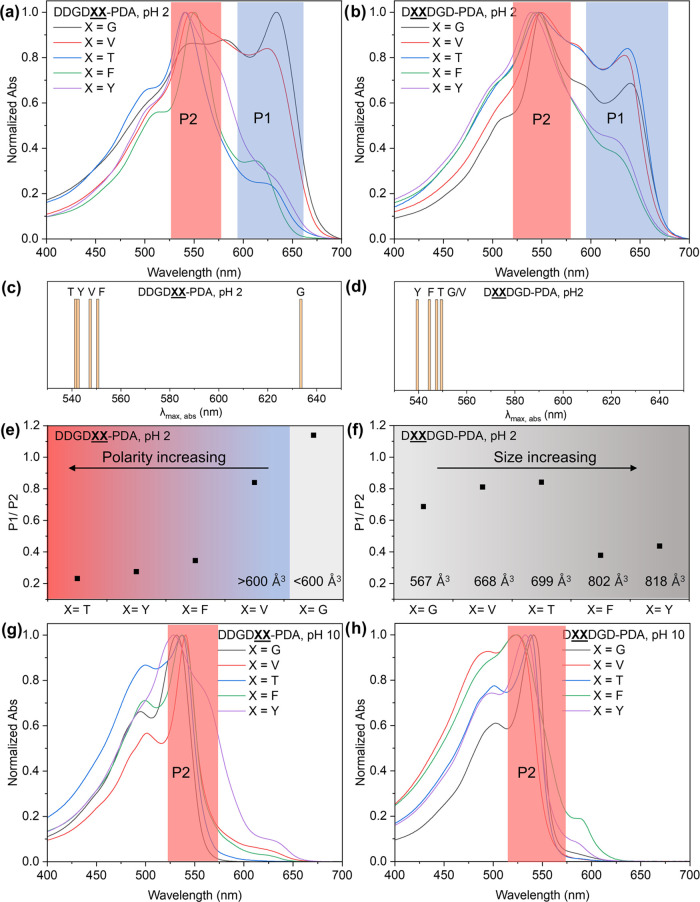
Absorption spectra of 1 mM (a) DDGDXX-PDA and (b) DXXDGD-PDA polymerized with 40 min 254 nm UV irradiation at pH 2 (X = G, V, T, F, and Y). Schematic diagram showing the hypsochromic shift of λmax, for (c) DDGDXX-PDA (X = V, T, F, and Y) absorption compared to λmax, for DDGDGG-PDA absorption at pH 2, and for (d) λmax of DXXDGD-PDA (X = V, T, F, and Y) absorption compared to λmax of DGGDGD-PDA absorption at pH 2. The P1/P2 intensity ratio for (e) DDGDXX-PDA and (f) DXXDGD-PDA with 40 min UV irradiation at pH 2 showed size-dependent trends for both isomers where substitution with larger residues favor the formation of red phase. Comparison between sequences of similar size but varying polarity did not show drastic changes in P1/P2 values except for DDGDVV and DDGDTT. UV–vis spectra of 1 mM (g) DDGDXX-PDA and (h) DXXDGD-PDA polymerized with 40 min 254 nm irradiation at pH 2 then switched to pH 10.

