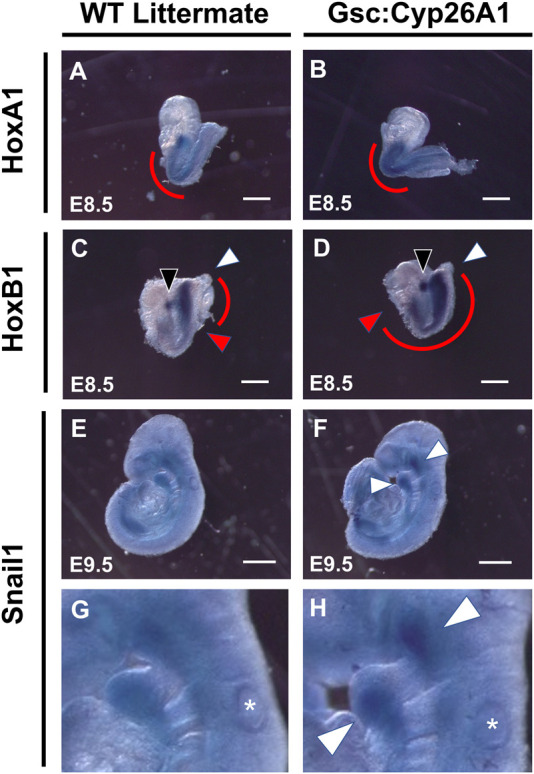
FIGURE 5.

Gsc +/Cyp26A1 embryos have delayed HoxA1 and HoxB1 transcriptional expression. In-situ hybridization studies show that E8.5 Gsc +/Cyp26A1 embryos have increased HoxA1 expression in the somatic (caudal to the hindbrain) and the trunk regions (B), (red curve), compared to WT littermates (A), (red curve). (D) E8.5 Gsc +/Cyp26A1 embryos have increased HoxB1 expression in rhombomere 4 (open white arrowhead) and increased expression and expansion in the somatic and trunk regions of the embryo (red curve, red arrowhead indicates rostral end of expression profile, white arrowhead indicates caudal end of expression profile), compared to WT littermates (C). Snai1 (neural crest cell lineage marker) expression pattern is similar between E9.5 Gsc +/Cyp26A1 and WT littermate embryos (E, F); but there remains regions (maxillary and branchial arch 1 & 2 regions, white arrows) with increased Snai1 expression in Gsc +/Cyp26A1 embryos (enlarged in G, H; respectively). * = otic vesicle. HoxA1 n = 15 embryos, HoxB1 n = 14 embryos, Snail1 n = 9 embryos, n = 2 (litters) per timepoint. Scale Bars: 200 um (A–D), 500 um (E–F).
