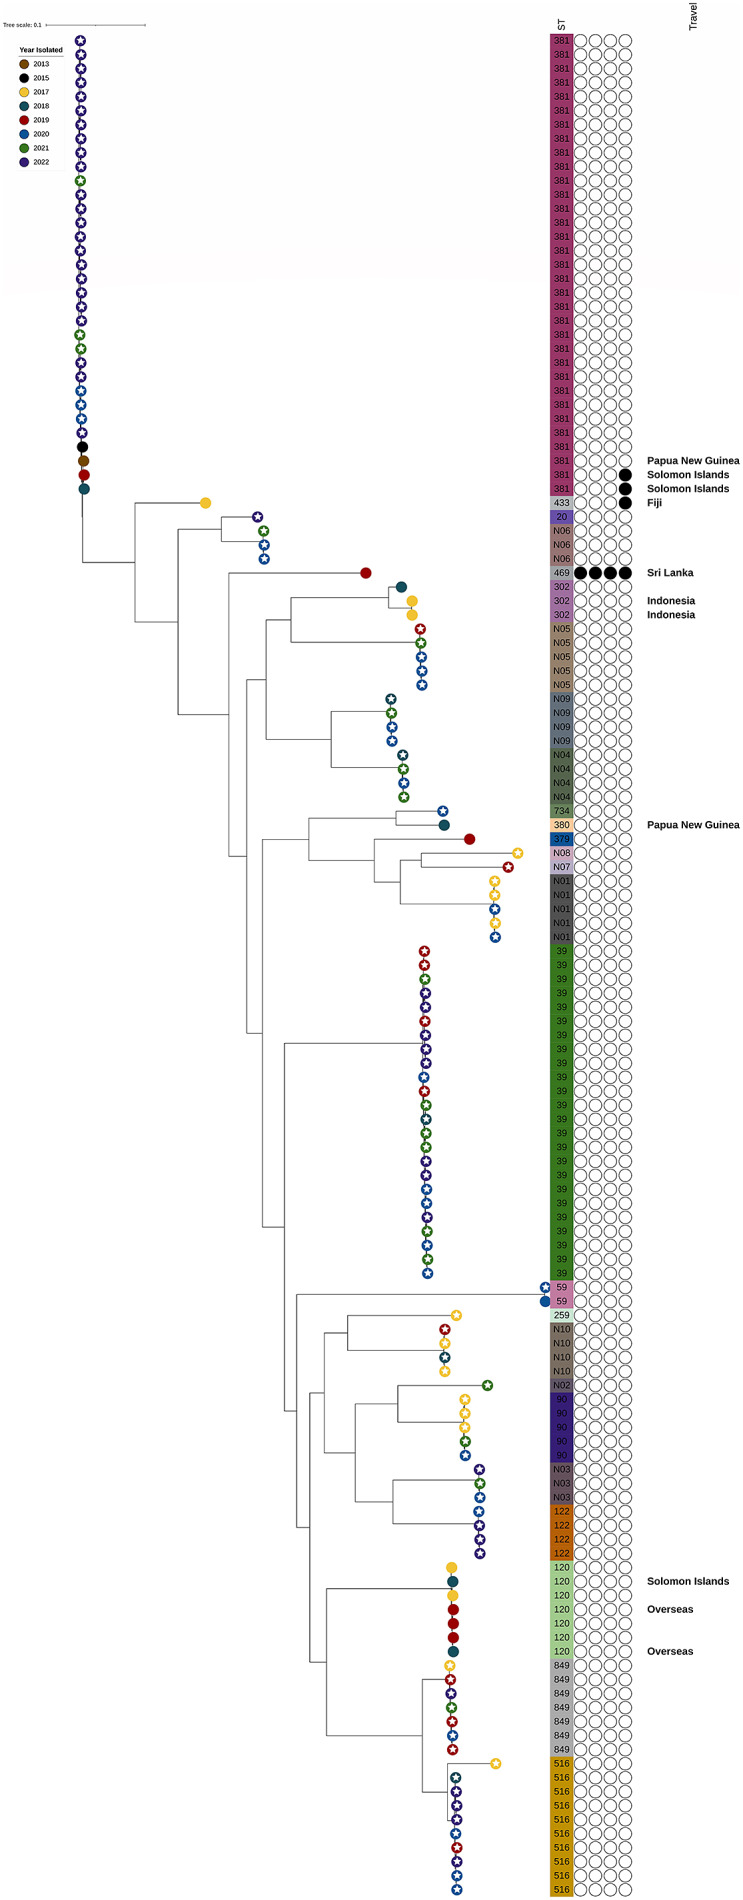
Figure 1.

Maximum likelihood tree built using SNP differences between Corynebacterium diphtheriae isolates. Colours of leaves represent the year isolated and white stars on leaves indicate that the isolate was from the NQ region. ST and AMR genes are indicated to the right of the tree. Branch length represents genetic distance as indicated by the scale bar.
