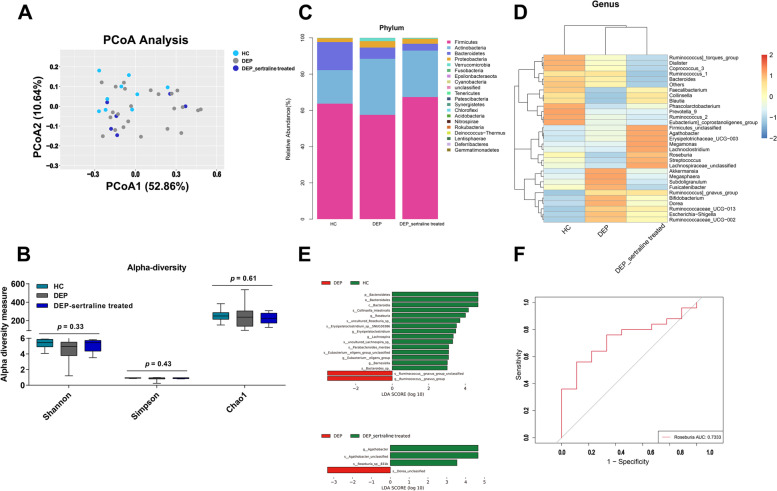
Fig. 1.
Alteration of GM in depressive adolescents. A Principal coordinate analysis of β diversity based on weighted UniFrac distances in the HC, DEP, and DEP-sertraline-treated groups. B Shannon, Simpson, and Chao1 indices of α diversity. C Stacked chart of GM composition at the phylum level. D Heatmap of the relative abundances of the top 30 microbiota genera. E Linear discriminant analysis effect size (LEfSe) analysis between group HC and DEP/ group DEP and DEP-sertraline-treated. F ROC curve of Roseburia in predicting adolescent depression according to binary logistic regression model between relative abundance of genus Roseburia and their groups (HC or DEP). Data were displayed as Minimum to Maximum in B. Significant differences among the three groups were determined via Kruskal-Wallis test

