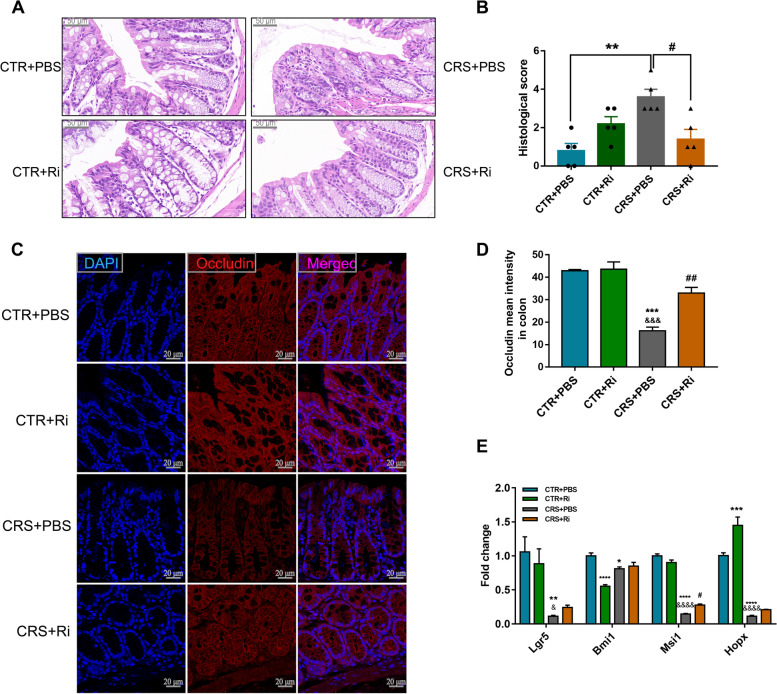
Fig. 11.
Ri. treatment reversed colon barrier impairment in CRS mice. A, B H&E staining of the mice colons (scale bar 50 μm) along with the histological score analysis. C, D IF images C and MFI analysis D of Occludin; scale bar 20 μm. E mRNA expression of ISC markers. Data were displayed as mean ± SEM. Significant differences were determined via two-way ANOVA and Tukey’s multiple comparison procedure. *p < 0.05, **p < 0.01, ***p < 0.001, ****p < 0.0001 vs. the CTR + PBS group; &p < 0.05, &&&p < 0.001, &&&&p < 0.0001 vs. the CTR + Ri group; #p < 0.05, ##p < 0.01 vs. the CRS + PBS group

