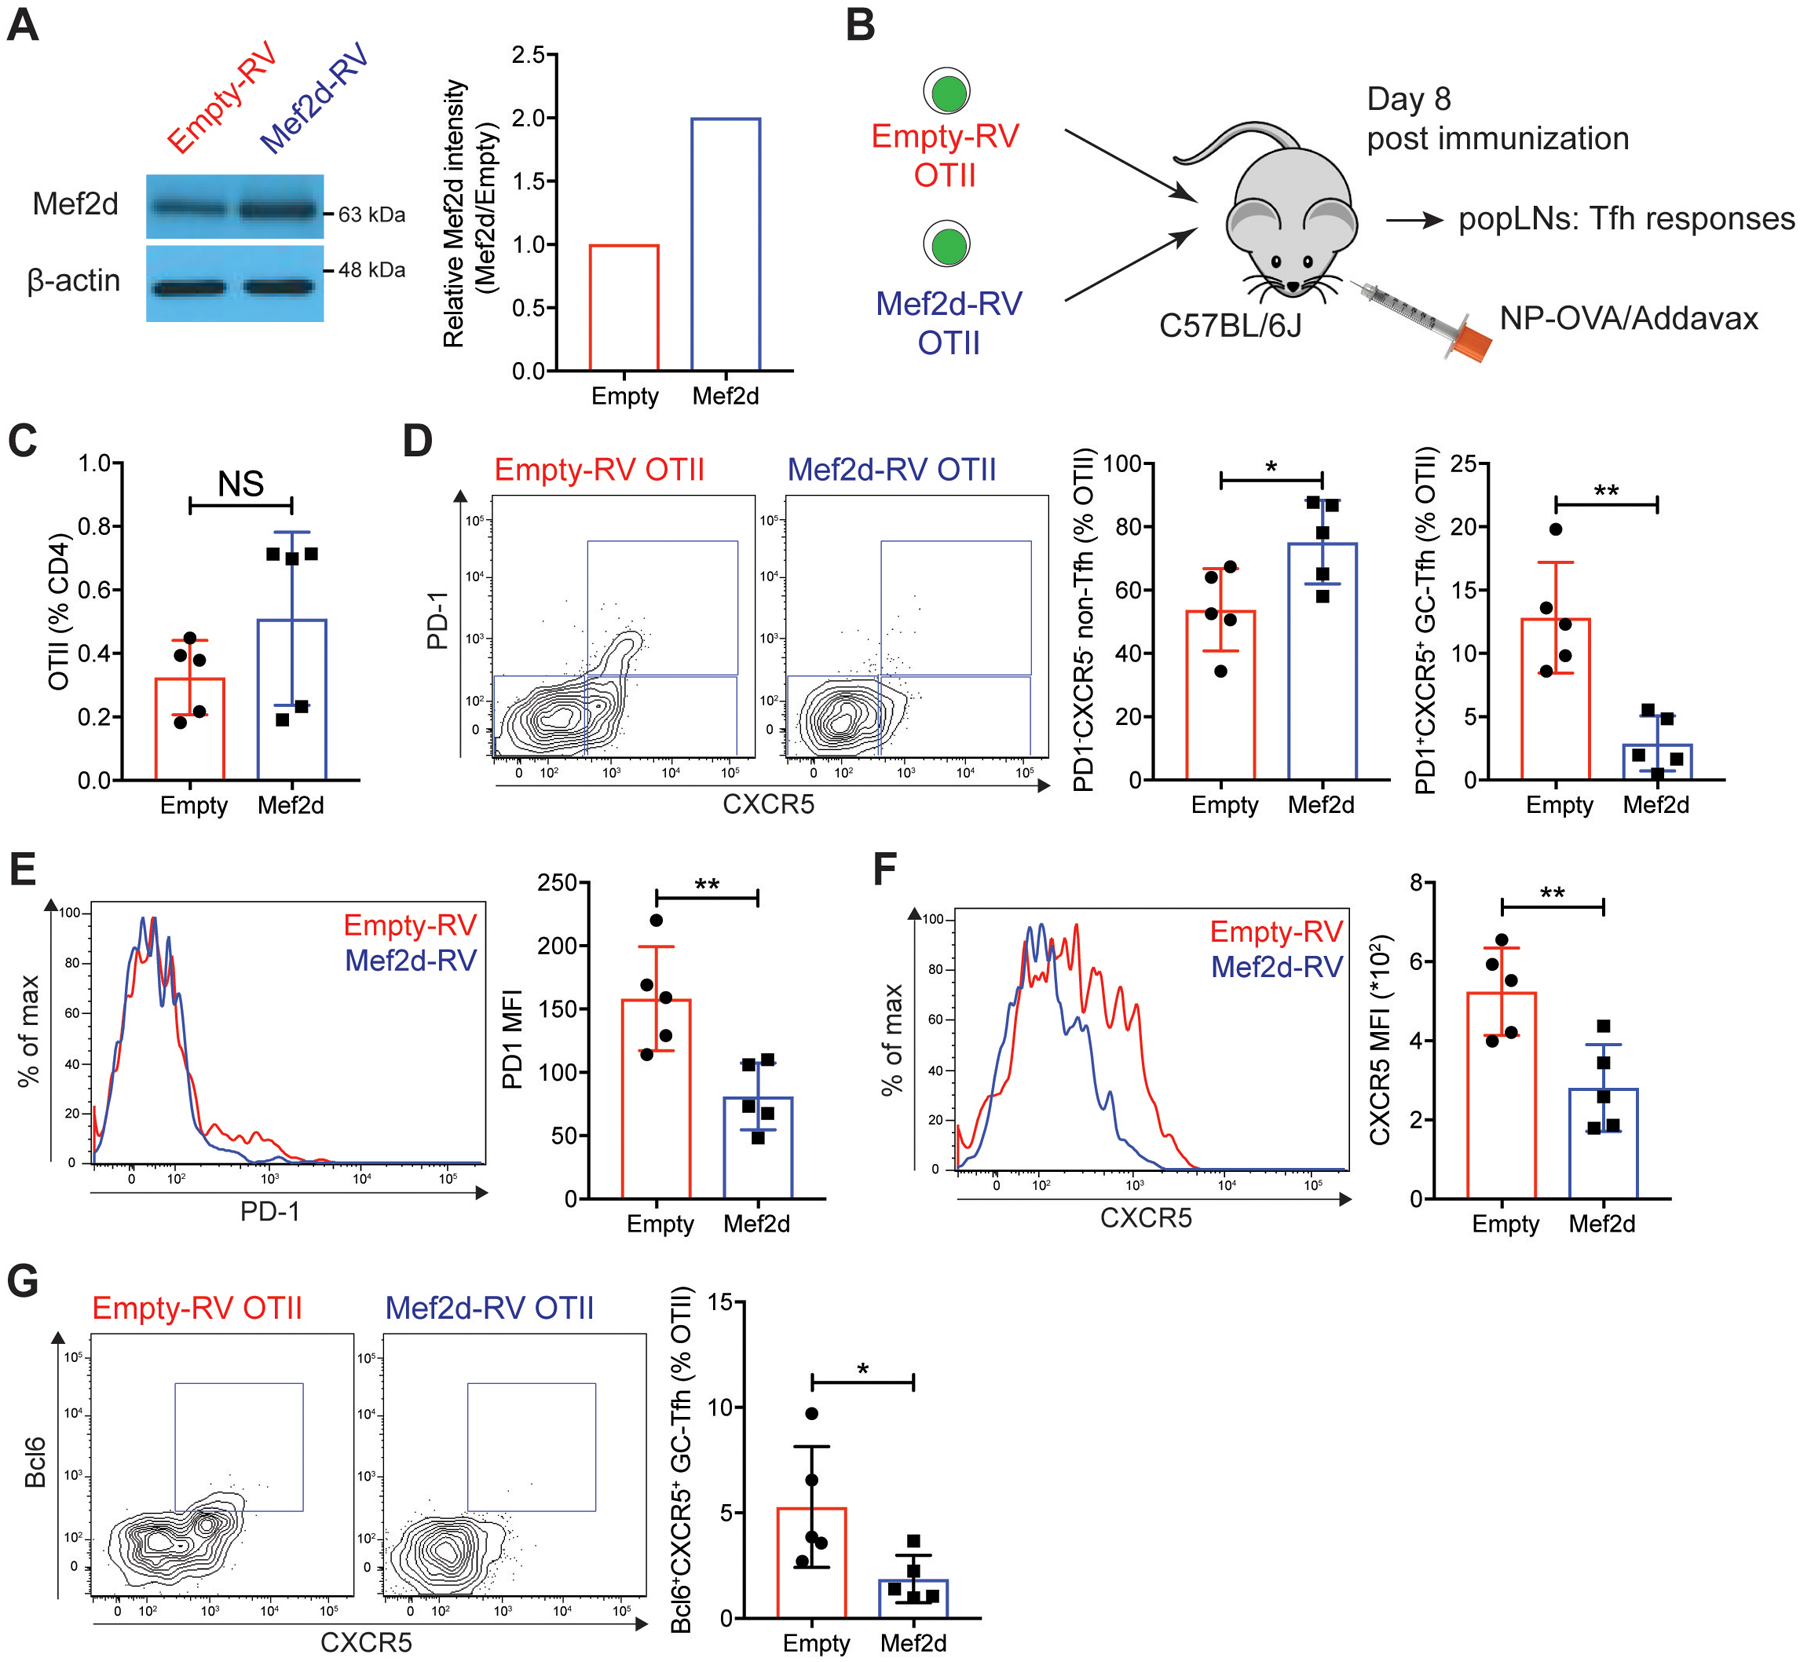
Fig. 1. Mef2d inhibits germinal center Tfh (GC-Tfh) formation of OTII TCRtg CD4 T cells.

(A) Immunoblots of β-actin and Mef2d protein. Relative Mef2d band intensity of Mef2d-RV cells to those of empty-RV cells.
(B) Experimental scheme. Equal numbers of empty-RV or Mef2d-RV OTII CD4 T cells were transferred to C57BL/6J mice. Eight days after subcutaneous footpad immunization with NP-OVA, popLNs were examined for GC-Tfh differentiation of GFP+ OTII CD4 T cells.
(C) The frequencies of GFP+ OTII CD4 T cells calculated as the percentage of total CD4 T cells.
(D) Flow cytometry plots of GFP+ OTII CD4 T cells. Gates indicate PD-1−CXCR5− non-Tfh, PD-1−CXCR5+ Tfh, and PD-1+CXCR5+ GC-Tfh cells. Quantified frequencies of PD-1−CXCR5− non-Tfh and PD-1+CXCR5+ GC-Tfh cells among GFP+ OTII CD4 T cells.
(E and F) Overlaid histograms of PD-1 (E) and CXCR5 (F) of empty-RV (red) or Mef2d-RV (blue) OTII CD4 T cells. MFIs were calculated.
(G) Flow cytometry plots of GFP+ OTII CD4 T cells with gates indicating Bcl6+CXCR5+ GC-Tfh cells. The frequencies of Bcl6+CXCR5+ GC-Tfh cells were calculated.
Representative of two independent experiments with n=4–5 per group.
Error bars indicate mean with SD. Statistical significance values were determined using two-tailed Student’s t-test. NS, statistically non-significant; * p <0.05; ** p <0.01.
