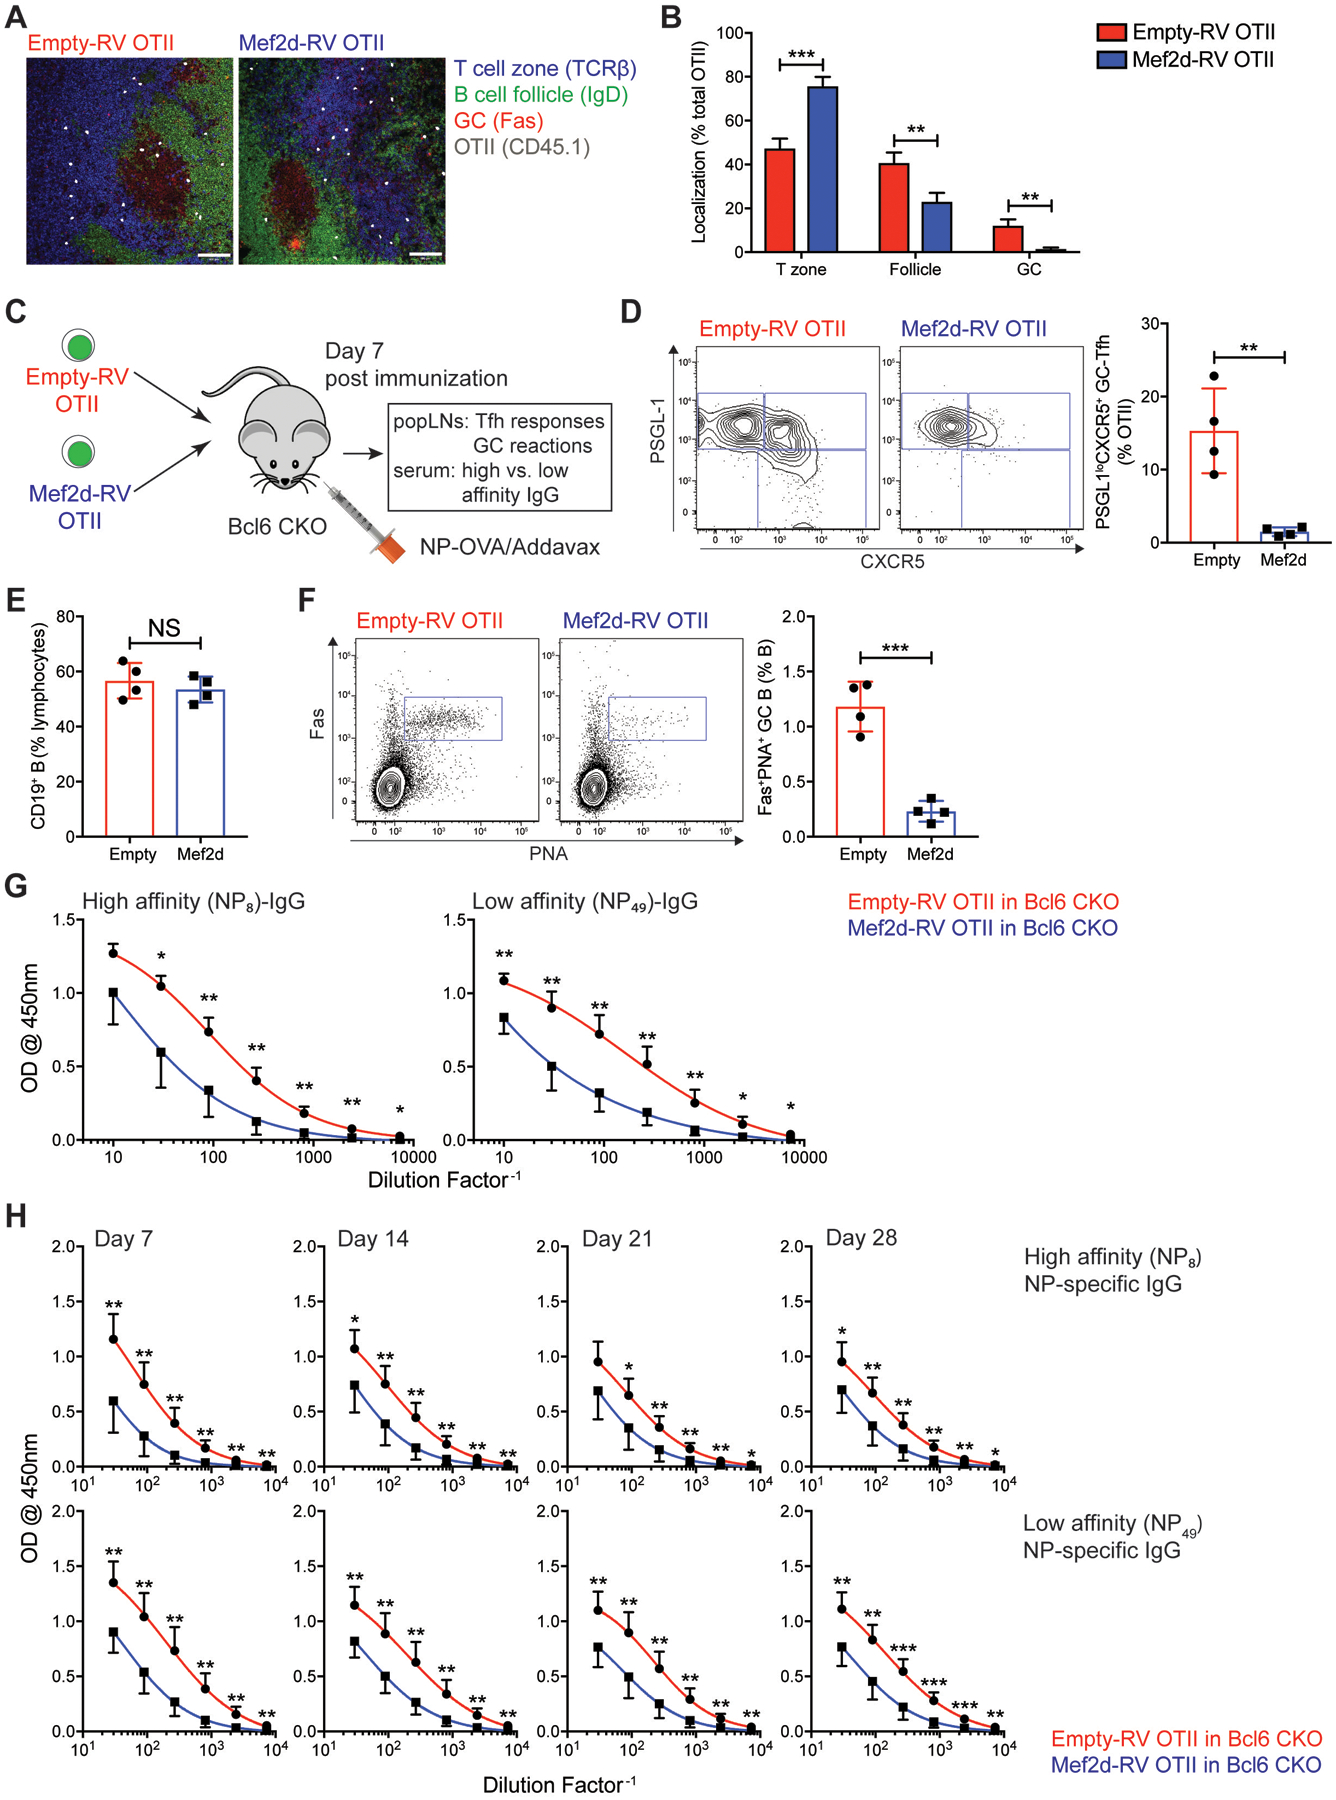
Fig. 2. Germinal center formation and antigen-specific antibody production by B cells are negatively regulated by Mef2d function in CD4 T cells.

(A) Empty-RV (left) or Mef2d-RV (right) CD45.1 OTII CD4 T cell were transferred into C57BL/6J mice. Seven days after NP-OVA immunization, popLNs were taken for IF analysis of CD45.1 OTII CD4 T cell localization (T cell zone, B cell follicle, or GC area). CD45.1 OTII CD4 T cells were shown in large dots to clarify. Scale bar = 100μm.
(B) The frequencies of CD45.1 OTII CD4 T cells positioned in each location were calculated.
(C to G) Empty-RV or Mef2d-RV OTII CD4 T cells were transferred into Bcl6 CKO (Cd4CreBcl6fl/fl) mice, which were immunized subcutaneously with NP-OVA. Seven days after NP-OVA immunization, popLNs and serum were examined for GC-Tfh differentiation and GC formation and NP-specific IgG production, respectively.
(C) Experimental scheme for investigating the regulation of humoral immune response by the Mef2d function of CD4 T cells.
(D) Flow cytometry plots of GFP+ OTII CD4 T cells present in popLNs of Bcl6 CKO mice. Gates indicate PSGL-1hiCXCR5− non-Tfh, PSGL-1hiCXCR5+ Tfh, and PSGL-1loCXCR5+ GC-Tfh cells. The frequencies of PSGL-1loCXCR5+ GC-Tfh cells were quantified.
(E) The frequencies of CD19 B cells. Calculated as the percentage of total lymphocytes.
(F) Flow cytometry plots of CD19 B cells with gates indicating Fas+PNA+ GC B cells. The GC B cell frequencies among the total B cells were calculated.
(G) Amounts of high- (NP8-BSA) and low- (NP49-BSA) affinity NP-specific IgG antibodies measured in serum from Bcl6 CKO mice adoptively transferred with empty-RV (red) or Mef2d-RV (blue) OTII CD4 T cells.
(H) Empty-RV (red) or Mef2d-RV (blue) OTII CD4 T cells were adoptively transferred into Bcl6 CKO mice, which were bled at days 7, 14, 21 and 28 after NP-OVA immunization. The high- and low-affinity NP-specific IgG production was measured by ELISA.
Representative of two independent experiments (n=4–5 per group) (C to G) and composite data from two independent experiments using n=6 recipient mice per group (H).
Error bars indicate mean with SEM (B) and mean with SD (D to H). Statistical significance values were determined using two-tailed Student’s t-test. NS, statistically non-significant; * p <0.05; ** p <0.01; *** p <0.001.
