
Fig. 5. Mef2d negatively regulates GC-Tfh differentiation of antigen-specific CD4 T cells via DNA binding-dependent regulation of SAP expression.
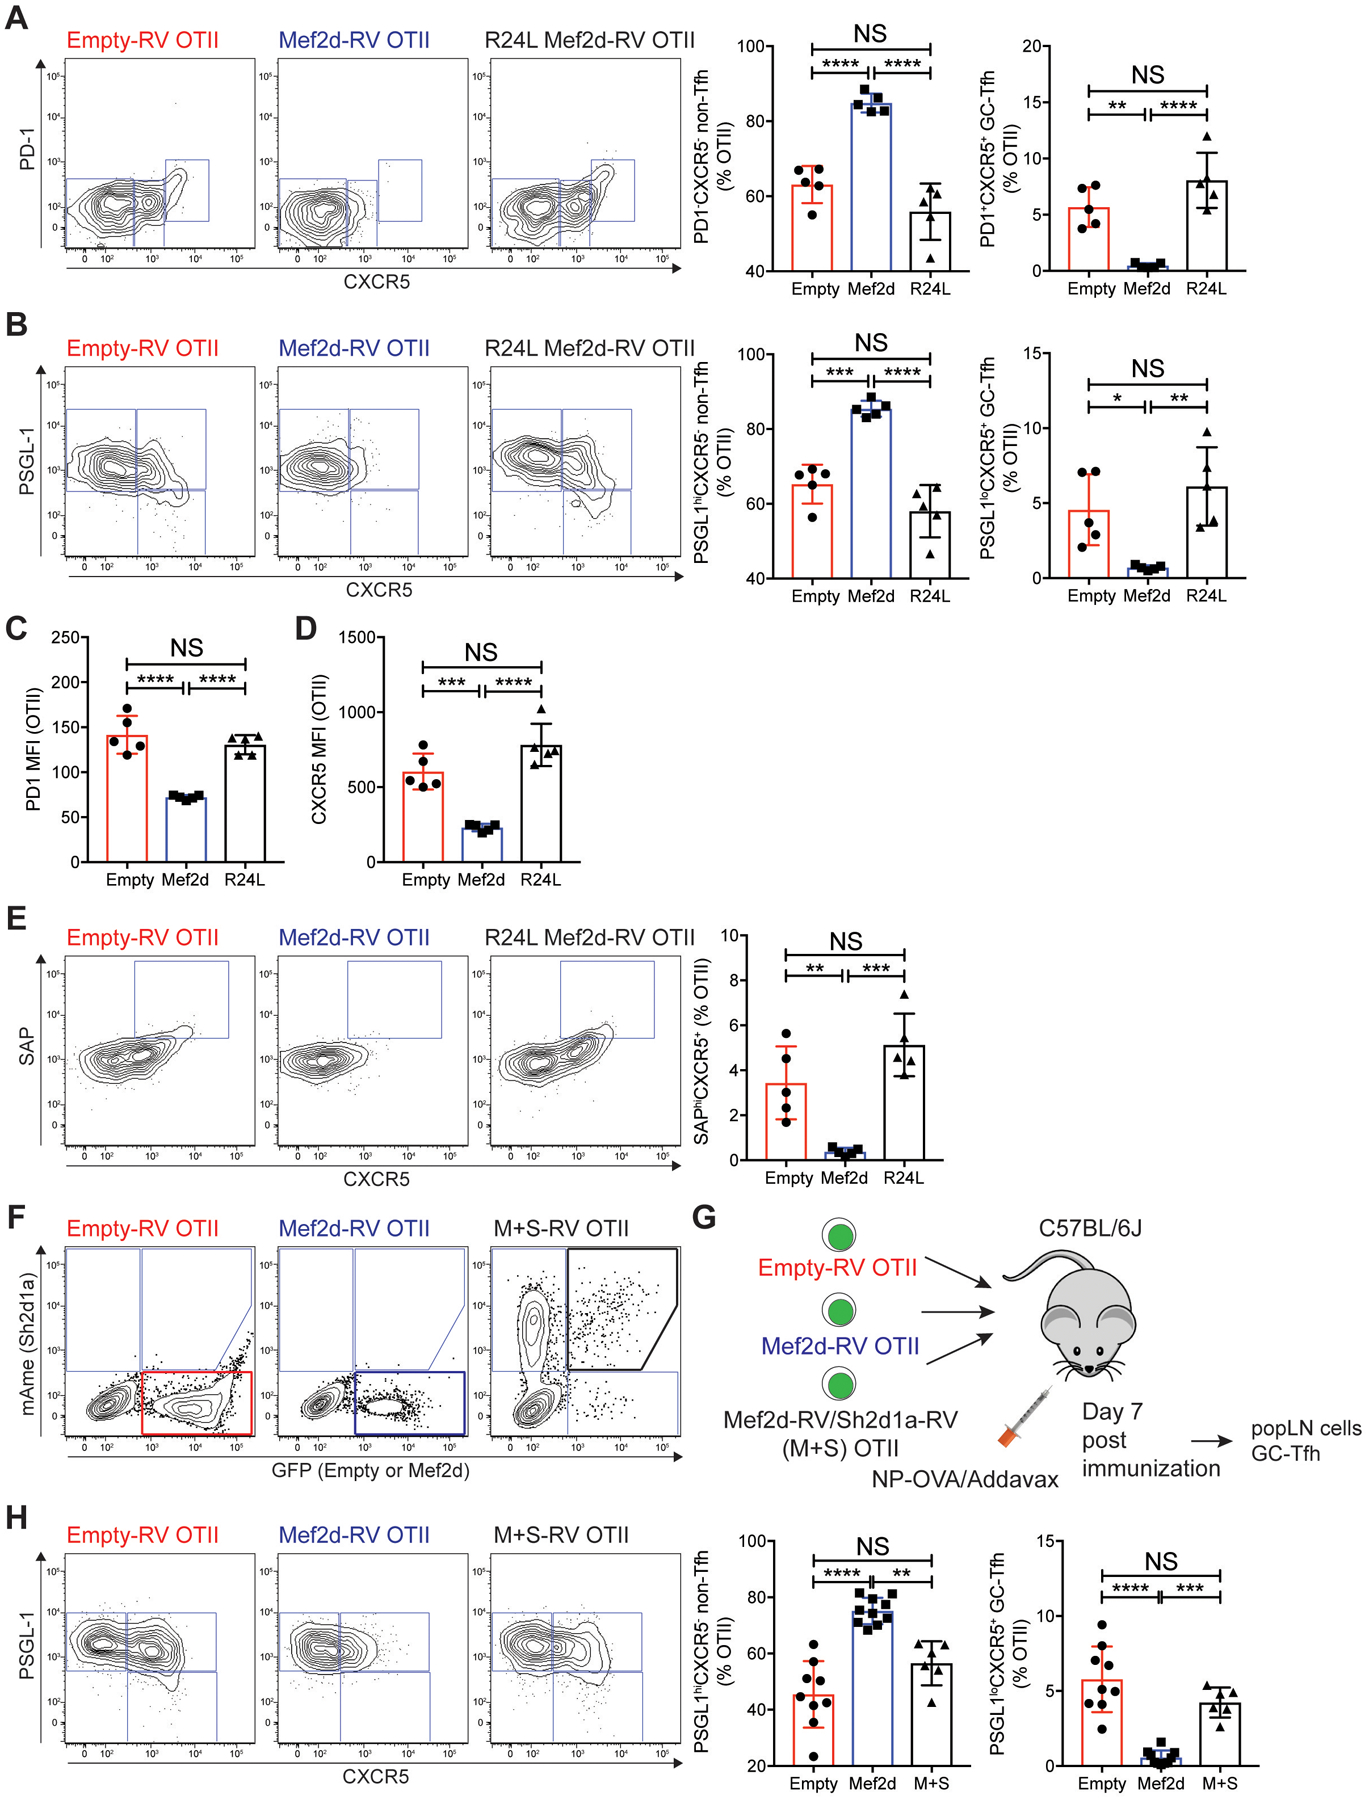
(A to E) Empty-RV (red), Mef2d-RV (blue), or R24L Mef2d-RV (black) CD45.1 OTII CD4 T cells were adoptively transferred into C57BL/6J mice, which were immunized subcutaneously with NP-OVA. Seven days after NP-OVA immunization, the transferred GFP+ CD45.1 OTII CD4 T cells in popLNs were analyzed.
(A and B) Flow cytometry plots of GFP+ CD45.1 OTII CD4 T cells. Gates indicate non-Tfh (PD-1−CXCR5− or PSGL-1hiCXCR5−), Tfh (PD-1−CXCR5+ or PSGL-1hiCXCR5+), and GC-Tfh (PD-1+CXCR5+ or PSGL-1loCXCR5+) cells. The frequencies of non-Tfh and GC-Tfh cells developed from the respective donor cells were calculated.
(C and D) MFIs of PD-1 (C) and CXCR5 (D) of the donor cells were quantified.
(E) Flow cytometry plots of the donor cells. Gates indicate the SAPhiCXCR5+ compartment. The SAPhiCXCR5+ cell frequencies were calculated.
(F to H) GC-Tfh differentiation of Mef2d-RV OTII CD4 T cells was examined in the presence or absence of ectopic co-expression of SAP.
(F) Flow cytometry plots CD45.1 OTII CD4 T cells transduced with empty-RVGFP or Mef2d-RVGFP with or without Sh2d1a-RVmAmetrine. Empty-RVGFP+ (red box), Mef2d-RVGFP+ (blue box), or Mef2d+Sh2d1a-RVGFP+mAmetrine+ (black box) OTII CD4 T cells were highlighted.
(G) The respective RV+ OTII CD4 T cells were sorted and transferred into C57BL/6J mice. Seven days after NP-OVA immunization, popLNs were examined for GC-Tfh differentiation and IL-21 production (fig. S7, C–D) of the donor OTII CD4 T cells were examined.
(H) Flow cytometry plots of RV+ OTII CD4 T cells with gates indicating non-Tfh (PSGL-1hiCXCR5−), Tfh (PSGL-1hiCXCR5+), and GC-Tfh (PSGL-1loCXCR5+) cells. The frequencies of non-Tfh and GC-Tfh cells were calculated.
Representative of three independent experiments with n=5 mice per group (A to E) and composite data from two independent experiments using n=6–10 recipient mice per group (F to H).
Error bars indicate mean with SD. Statistical significance values were determined using one-way ANOVA with Tukey’s multiple comparisons test. NS, statistically non-significant; * p <0.05; ** p <0.01; *** p <0.001; **** p <0.0001.