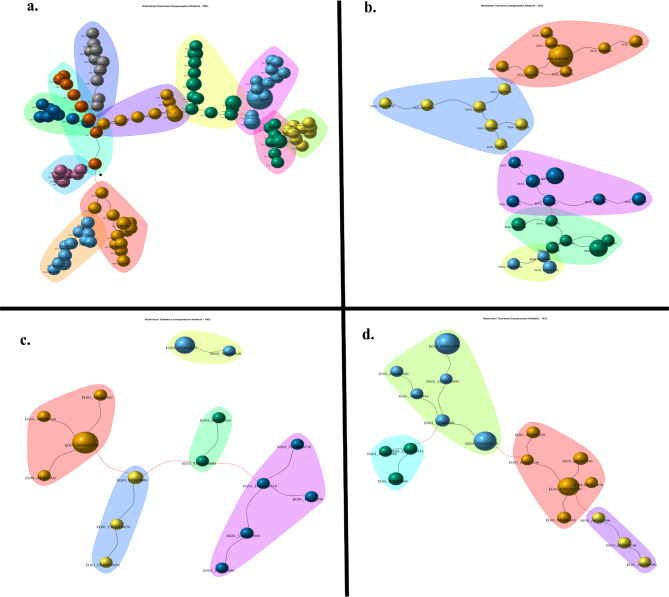
Fig. 3.
Gene co-expression network for each cultivar. (a) IRHO 7001, (b) CTR 3-0-12, (c) CR 10-0-2, and (d) CD 19 − 12. Each node (sphere or bead-like shape) represents a gene, and groups of nodes highlighted with the same color indicate a module of genes. Black edges represent a direct correlation between genes and the red lines’ inverse correlation. The size of the nodes is proportional to the mean level expression of the gene represented by the node. The igraph R package was used to construct the cultivar-specific co-expression networks under Al and control treatment

