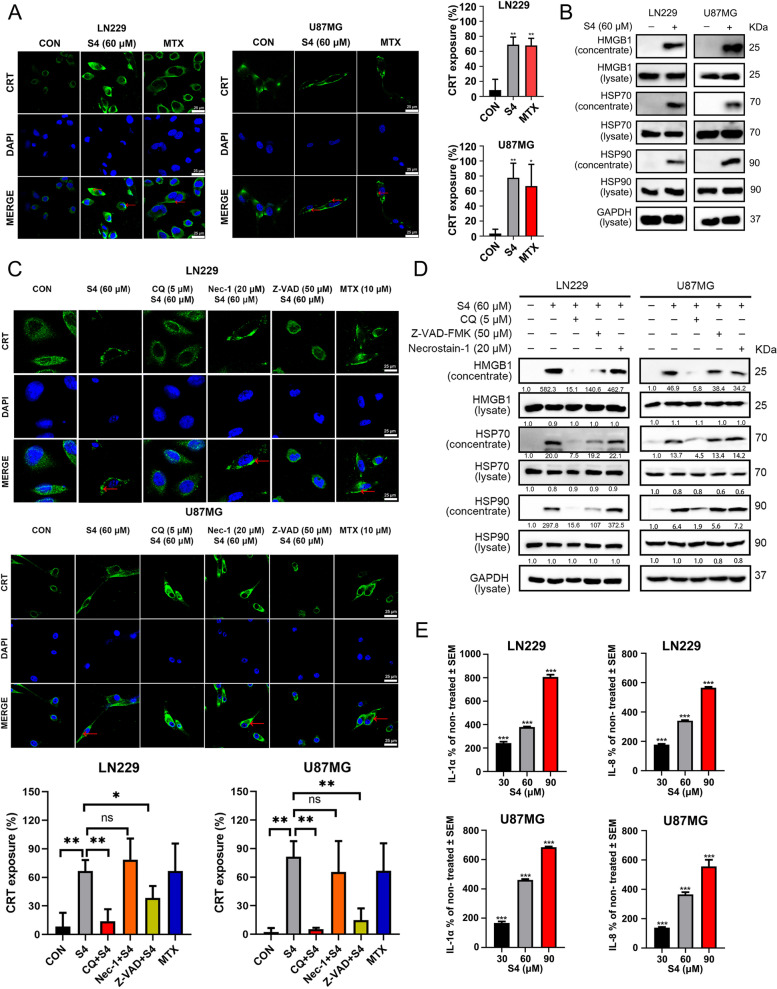
Fig. 3.
Autophagy and apoptosis are involved in S4-induced immunogenic cell death in glioma cells. A LN229 and U87MG cells were treated with DMSO or S4 (60 μM) for 24 h, then stained with an anti-CRT antibody (Green). DAPI was used for nuclear staining (blue). The exposure of calreticulin (CRT) was assessed by confocal imaging. Mitoxantrine (MTX) was used as a positive control. ImageJ software was used to calculate the percentage of CRT positive area (**p < 0.01). Arrowheads indicate positive area. Images are representative of three independent experiments. (scale bar = 25 μm). B LN229 and U87MG cells were treated as in (A), cell lysates were collected and concentrated. HMGB1 and HSP70/90 expression were measured by immunoblot (IB) analysis. GAPDH was used as a loading control. C LN229 and U87MG cells were pre-treated with either Z-VAD-FMK (50 µM), or chloroquine (CQ, 5 µM), or Necrostain-1 (20 µM), following treatment with S4 (60 μM) for 24 h, then exposure of CRT (green) was assessed by immunofluorescence staining. DAPI was used for nuclear staining (blue). MTX was used as a positive control. Arrowheads indicate positive area. (scale bar = 25 μm) (D) LN229 and U87MG cells were treated as in (C), cell lysates and cell-free supernatants (concentrated) were collected. HMGB1 and HSP70/90 levels were measured by IB analysis. GAPDH was used as a loading control. (E) LN229 and U87MG cells were treated with DMSO or S4 (30, 60, 90 μM). Release of IL1α and IL-8 from THP-1 cells co-cultured with conditioned media of S4-treated glioma cells was measured by ELISA. The release rate of control group was 100% for quantitative statistics. The above experiments were performed three times (*P < 0.05, **P < 0.01, ***P < 0.001)

