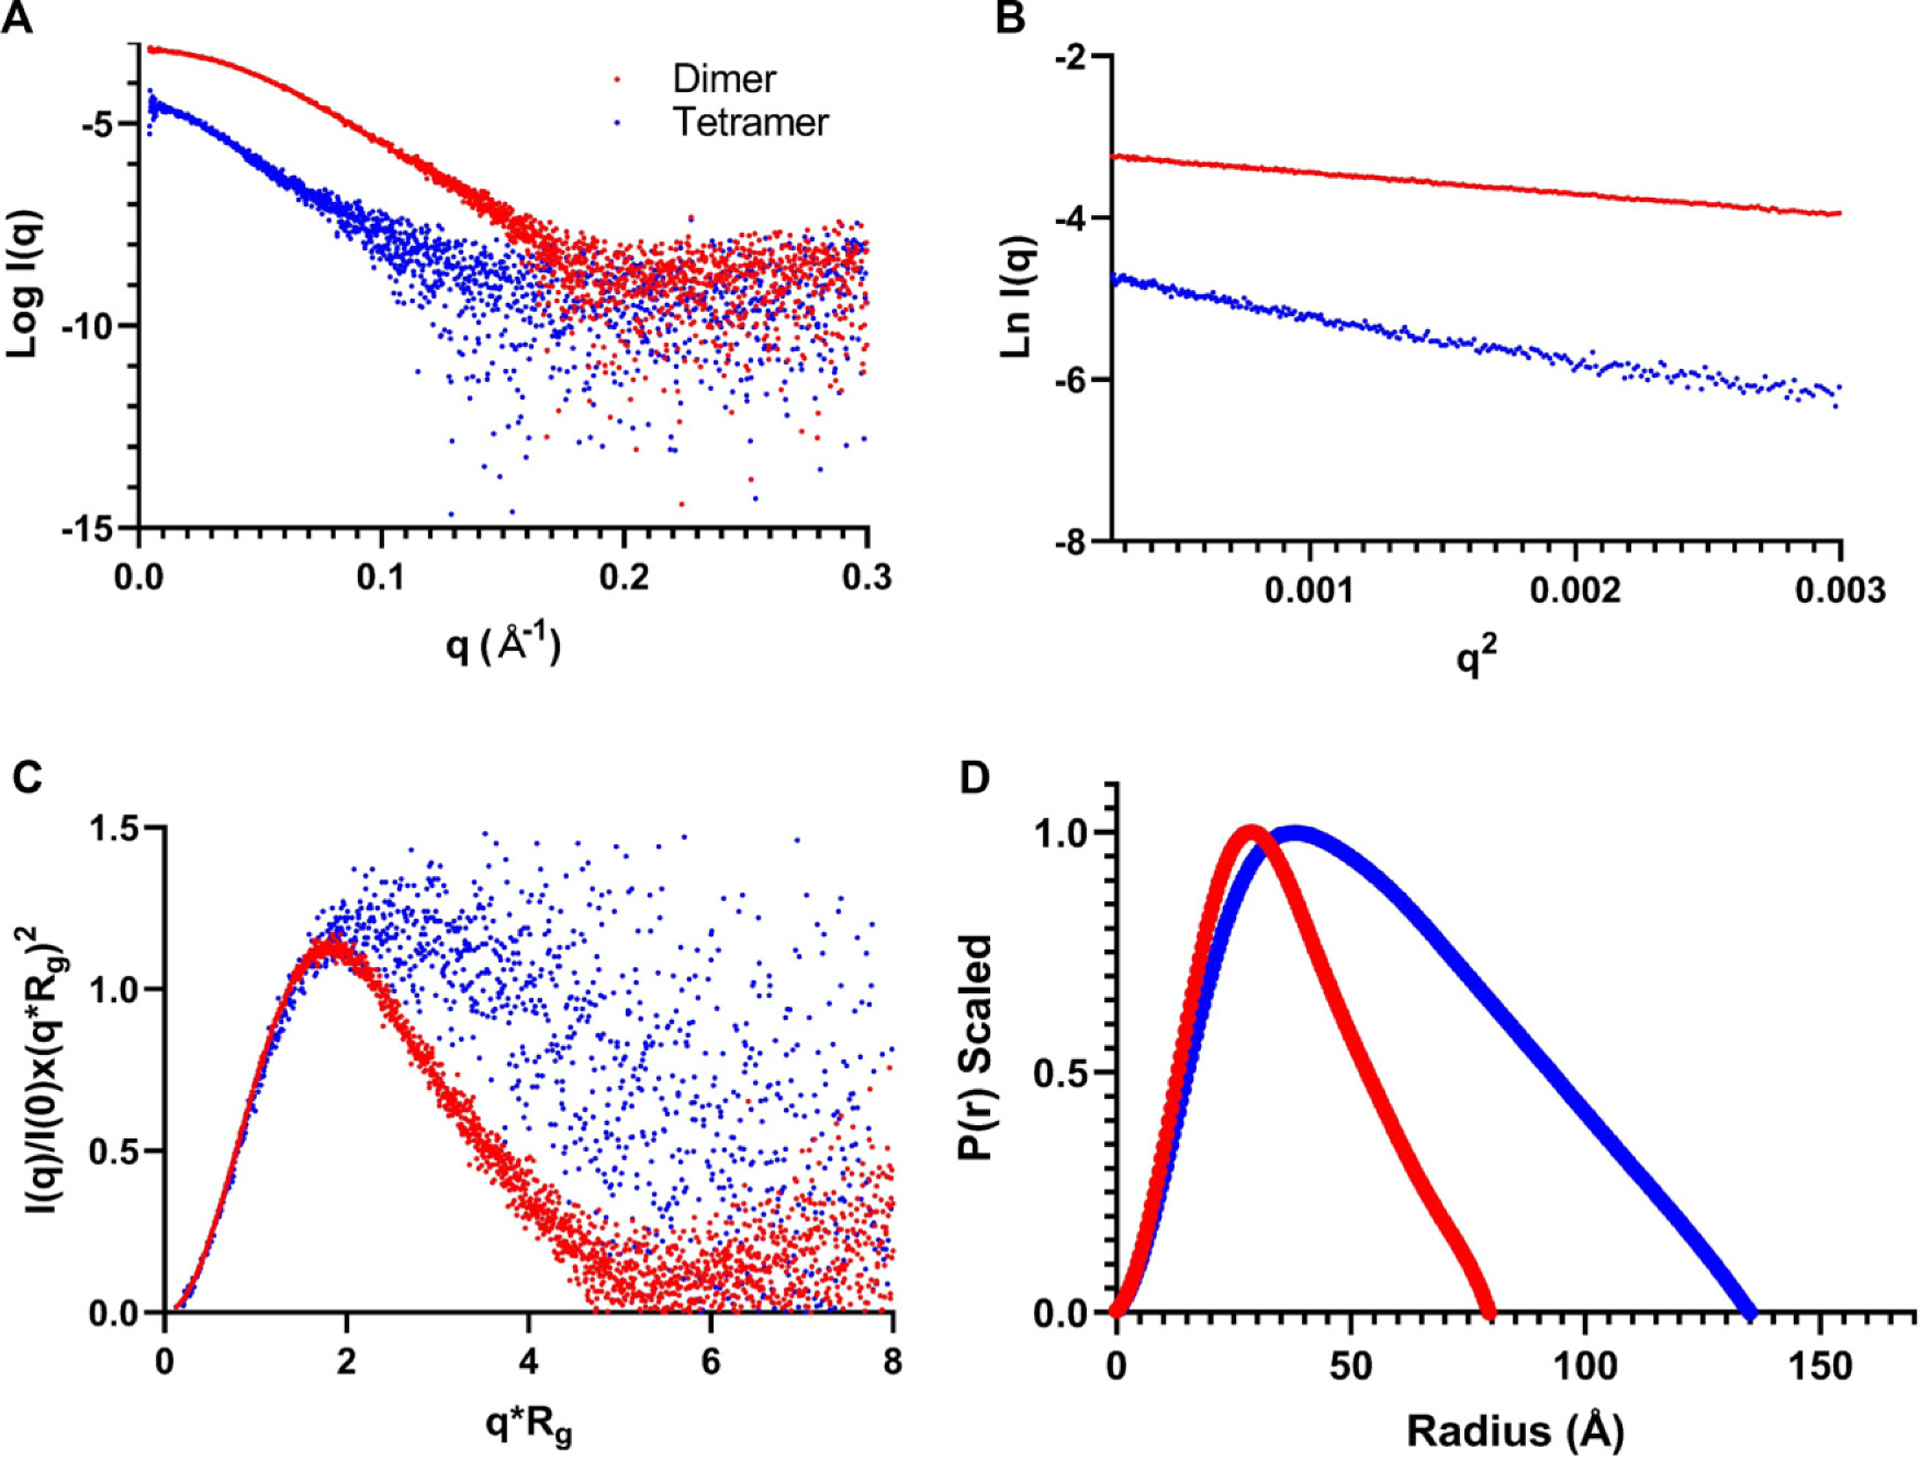
Fig. 4.

Characterization of iPPase oligomerization via SAXS. (A) Scattering intensity (log I(q)) vs. scattering angle (q = 4π sin θ/λ) represents merged SAXS data. (B) Guinier analysis (ln(I(q)) vs. q2) allows for homogeneity interpretation and determination of Rg via the low-angle region data. (C) Dimensionless Kratky plots (I(q)/I(0) × (qRg)2 vs. qRg) demonstrate that iPPase folds into a relatively globular state(s). (D) Pair-distance distribution (P(r)) plots for both iPPase peaks represent their maximal particle dimensions and allow Rg determination from the entire SAXS dataset.
