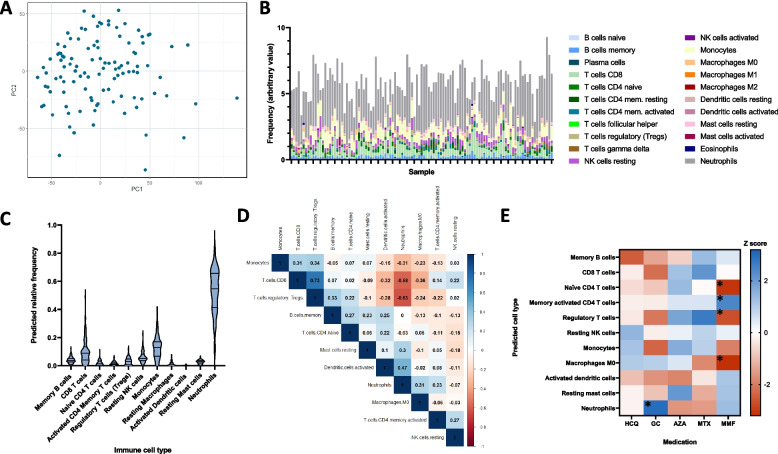
Fig. 1.
Predicted frequency of immune cell types in whole blood. A Principal component (PC) plot of PC1 and PC2 for all patient samples. B Relative frequency of each of the 22 cell types predicted using CIBERSORTx in each sample. C The predicted frequency of the 11 selected cell types in the whole cohort. D Correlation matrix of the 11 cell types in the whole cohort. Spearman r coefficients are shown and the intensity of the colour indicates the strength of the correlation. E Pseudoheatmap of the 11 cell types according to exposure to GC, HCQ and immunosuppressants. The colour shows the magnitude of the Z score, *p < 0.05. HCQ, hydroxychloroquine; GC, glucocorticoids; AZA, azathioprine; MTX, methotrexate; MMF, mycophenolate mofetil; CYC, cyclophosphamide

