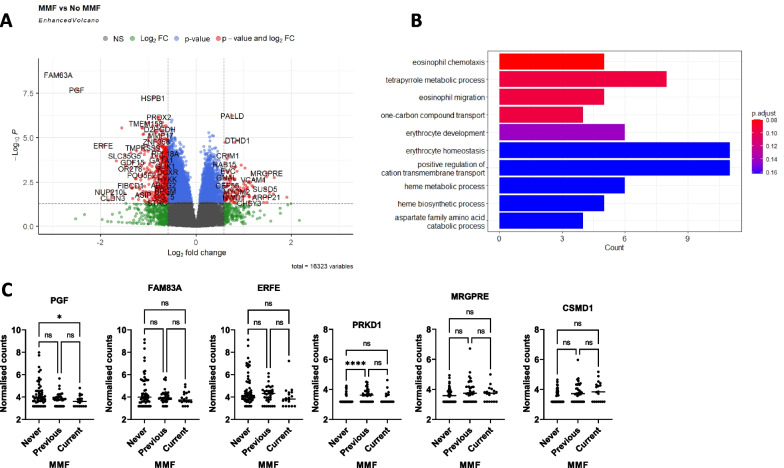
Fig. 3.
Whole blood gene signature in patients exposed to MMF. A Volcano plot to show differentially expressed genes between patients exposed to MMF or not. The y-axis shows -log10 adjusted p value and x-axis shows log2 fold change. Genes in red are differentially upregulated or downregulated with log2 fold change > 0.5 and adjusted p value < 0.05. B Gene set enrichment analysis of the 2607 differentially expressed genes. The x-axis shows the number of genes contributing to the term and the colour of the bar represents the p value. C Box plots of the 3 genes most significantly upregulated or downregulated according to MMF exposure. Horizontal bar shows median. Comparisons with Kruskal–Wallis test with Dunn’s correction. *p < 0.05, ****p < 0.0001

