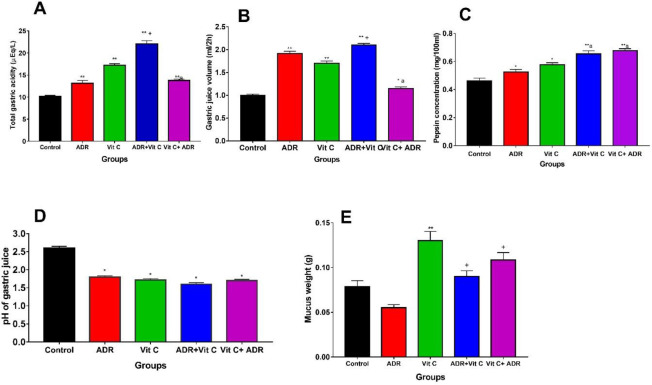
Figure 2.
Gastric secretions parameters in control and ADR rats treated with vitamin C
A: Total gastric acidity; B: Gastric juice volume; C: Pepsin concentration; D: pH of gastric juice; E: Mucus weight
** significant at P<0.05 vs control; a significant at P<0.05 vs Vit C, + significant at P<0.05 vs ADR, + significance at P<0.01 vs Vit C
Values are presented as mean ±SEM, n=6; ADR: Adrenaline

