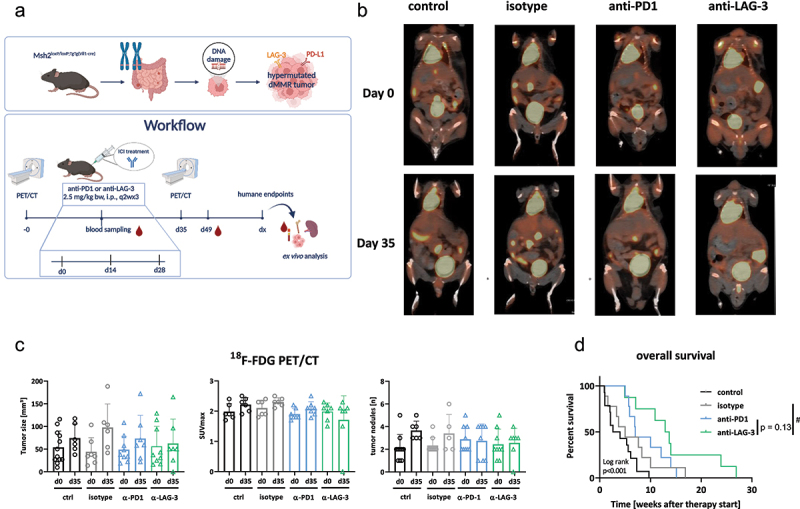
Figure 1.

Workflow, 18F-FDG PET/CT imaging in vivo, and overall survival of Msh2loxP/loxP;TgTg(Vil1-cre) mice treated with ICIs.
Notes: (a) Preclinical treatment schedule. (b, c) Tumor volume and SUVmax were measured via18F-FDG PET/CT imaging at start of therapy and after five weeks. (b) representative PET/CT images showing the impact of ICIs on tumor growth. (c) Longitudinal assessment of tumor volumes. Quantification was done at start of treatment and at day 35. Mean + SD. Each dot is representative for one mouse/timepoint. (d) Kaplan–Meier curve representing overall survival of mice. Control n = 10; isotype n = 10; -PD1n = 9; -LAG-3 n = 8, # p < 0.05 vs. isotype; Log-rank analysis (Mantel–Cox test).
