
Figure 3.
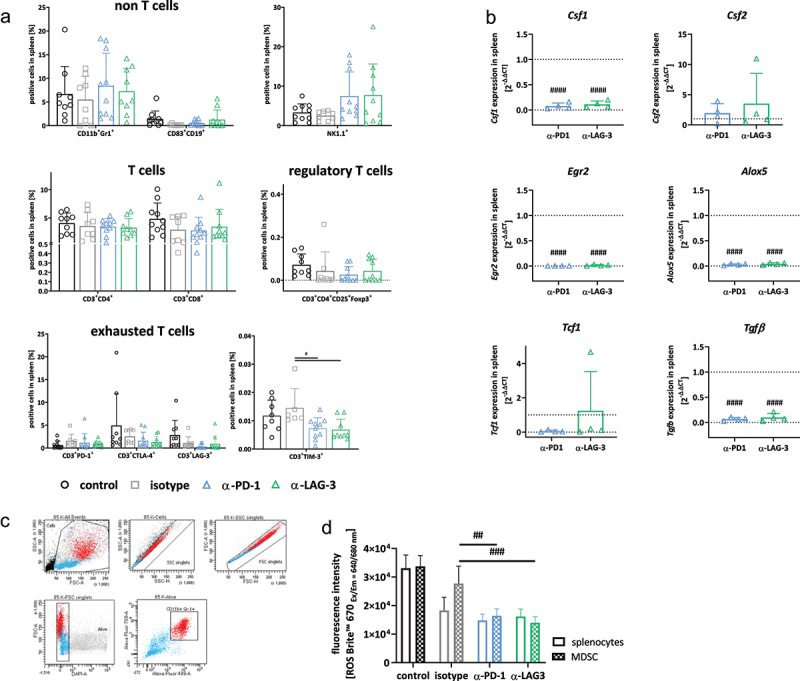
Spectral flow cytometry and gene expression analysis of spleens.
Notes: (a) Given is the number of % immune cells at the experimental endpoint resulting from 100,000 events measured on a flow cytometer. Each symbol represents one case. Control n = 10; isotype n = 8–9; -PD1n = 8–10; -LAG-3 n = 8–10; Two-way ANOVA (Tukey’s multiple comparisons test). (b) Quantitative qPCR of myeloid markers in the spleen. Total RNA from spleens was reverse transcribed into cDNA and qPCR was done as described in material and methods. Analysis was done in triplicates with n = 3–4 mice/group, respectively. All data are given as 2-ΔΔCT values + SD. Each symbol represents one case. #### p < 0.0001 vs. isotype. Two-way ANOVA (Tukey’s multiple comparisons test). (c, d) Sorting approach (CD11b+Gr1+ fraction) and determination of reactive oxygen species for functional myeloid-derived suppressor cell function analysis. (c) Whole spleen cells were labeled with anti-CD11b and anti-Gr1 antibodies and double positive cells were sorted. (d) Thereafter, cells were stimulated overnight with lipopolysaccharide from E. coli (100 ng/ml). ROS production from unsorted and CD11b+Gr1+ sorted splenic MDSCs was determined using ROS NIR™ 670. Fluorescence was measured on a preheated Tecan plate reader. Given is the fluorescence intensity (ROS determination). Mean + SD, n = 3–4 samples/group. # p < 0.05 and ## p < 0.01 vs. isotype; Two-way ANOVA (Tukey’s multiple comparisons test).