
Figure 4.
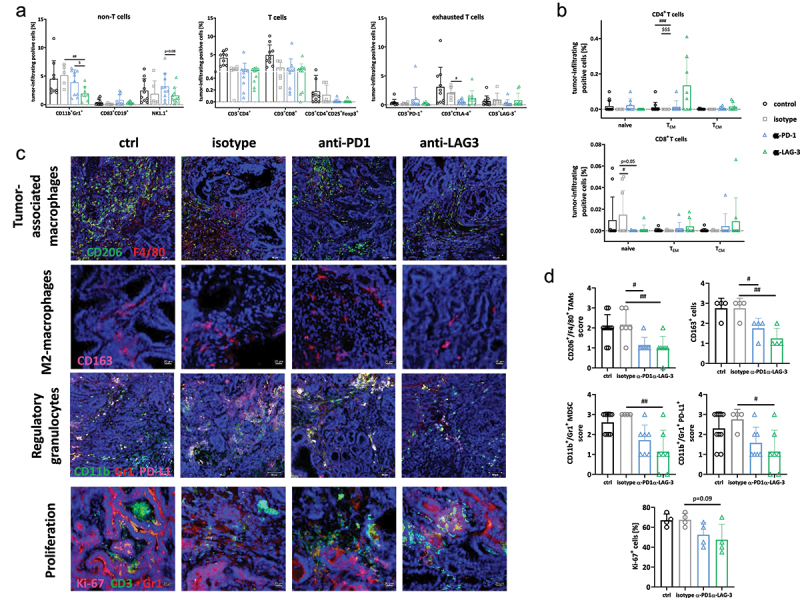
Characterization of the TME using spectral flow cytometry and immunofluorescence.
Notes: (a, b) Spectral flow cytometry. A panel of antibodies was used to examine the infiltration pattern within residual tumors. Given is the number of % immune cells at the experimental endpoint resulting from 100,000 events measured on a flow cytometer. Each symbol represents one case. Control n = 10; isotype n = 6–9; -PD1n = 6; -LAG-3 n = 6. # p < 0.05, ## p < 0.01 and ### p< 0.001 vs. isotype; $$$ p < 0.001 vs. ICI; Two-way ANOVA (Tukey’s multiple comparisons test). (c, d) The infiltration pattern of regulatory and tumor-associated (M2) macrophages, as well as Ki-67 proliferating cells was examined in residual tumor slides. Confocal laser scanning microscopy was done on a Zeiss Elyra 7 microscope. (c) Representative images of tumor slides. (d) Quantitative analysis of tumor-infiltrating immune cells counted in 2–3 HPFs/slide. Each symbol represents one case. Control n = 7–9; isotype n = 4–6; -PD1n = 4–7; -LAG-3 n = 4–7. # p < 0.05 and ## p < 0.01 vs. isotype; One-way ANOVA (Tukey’s multiple comparisons test).