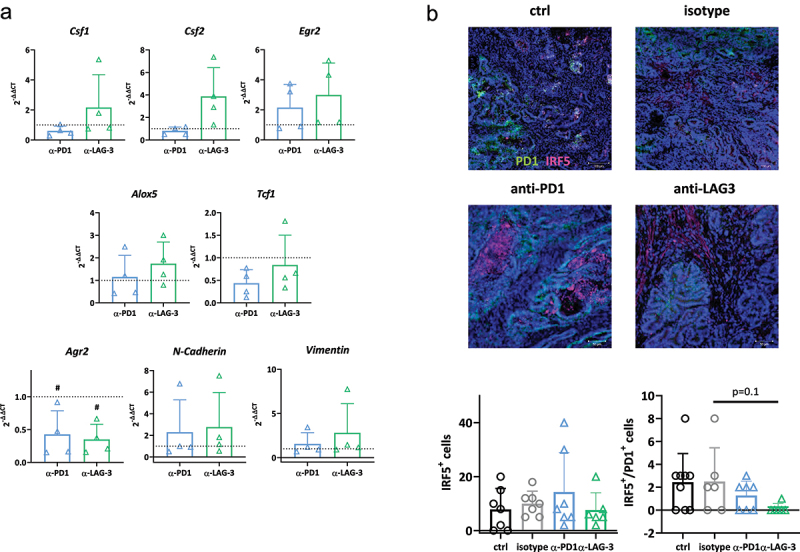
Figure 5.

Gene expression analysis in residual tumors and IRF5 detection by tumor immunofluorescence.
Notes: (a) Quantitative qPCR of myeloid and epithelial–mesenchymal transition markers in the tumor. Total RNA from residual tumors was reverse transcribed into cDNA and qPCR was done as described in material and methods. Analysis was done in triplicates with n = 4 mice/group, respectively. All data are given as 2-ΔΔCT values + SD. Each symbol represents one case. # p < 0.05 vs. isotype; One-way ANOVA (Tukey’s multiple comparisons test). (b) The infiltration pattern of IRF5+/PD1+ cells was examined in residual tumor slides. Confocal laser scanning microscopy was done on a Zeiss Elyra 7 microscope. (a) Representative images of tumor slides. (b) Quantitative analysis of tumor-infiltrating immune cells counted in 2–3 HPFs/slide. Control n = 10; isotype n = 4–6/marker; -PD1n = 7; -LAG-3 n = 7. The infiltration pattern was semi-quantitatively analyzed using a scoring system. 0 = no; 1 = mild; 2 = moderate; 3 = strong. Each symbol represents one case. One-way ANOVA (Tukey’s multiple comparisons test).
