
Figure 6.
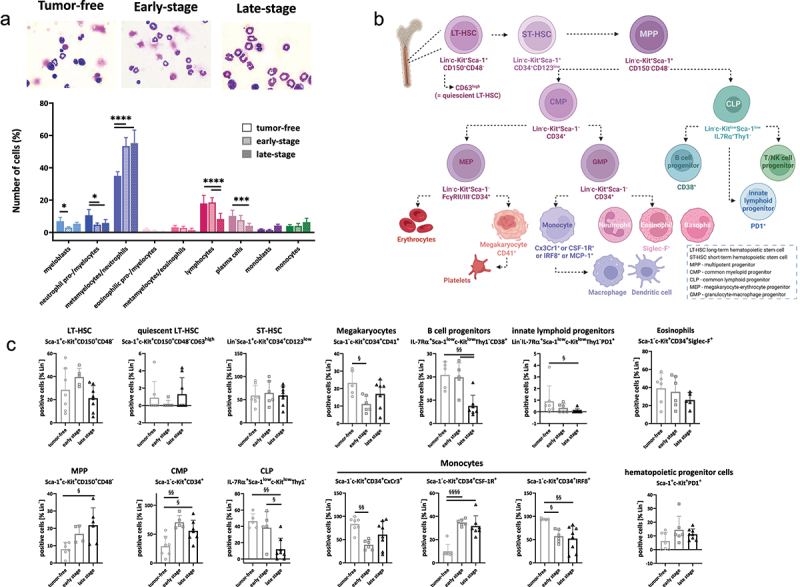
Altered murine haematopoiesis during tumor development.
Notes: (a) Pappenheim staining of bone marrow cells in normal, tumor-free and tumor-bearingMsh2loxP/loxPVillCre mice. From each slide, 200 cells were counted and differentiated according to a pre-designed differentiation scheme into the following cell types: myeloblasts, neutrophil pro-/myelocytes, metamyelocytes/neutrophil, eosinophilic pro-/myelocytes, metamyelocytes/eosinophils, lymphocytes, plasma cells, monoblasts, and monocytes. Upper part: representative images of each treatment. Magnification x1000; lower part: Quantification was done blinded by an experienced researcher. n = 7 mice/group. Mean + SD, * p<0.05; ** p<0.01; **** p<0.0001; One-way ANOVA (Sidak’s multiple comparisons test). (b, c) Bone marrow differentiation using multi-color spectral flow cytometry. (b) Diagram of hematopoiesis based on the markers used in this study. (c) A 20-marker panel was applied as described in material and methods. (c) Quantitative analysis of lin−c-Kit+ precursors according to the diagram shown in Figure 6b. Results show data from 100,000 cells/sample. Mean + SD, each symbol represents one case; § p < 0.05; §§ p < 0.01; §§§§ p < 0.0001; One-way ANOVA (Sidak’s multiple comparisons test).