
Figure 2.
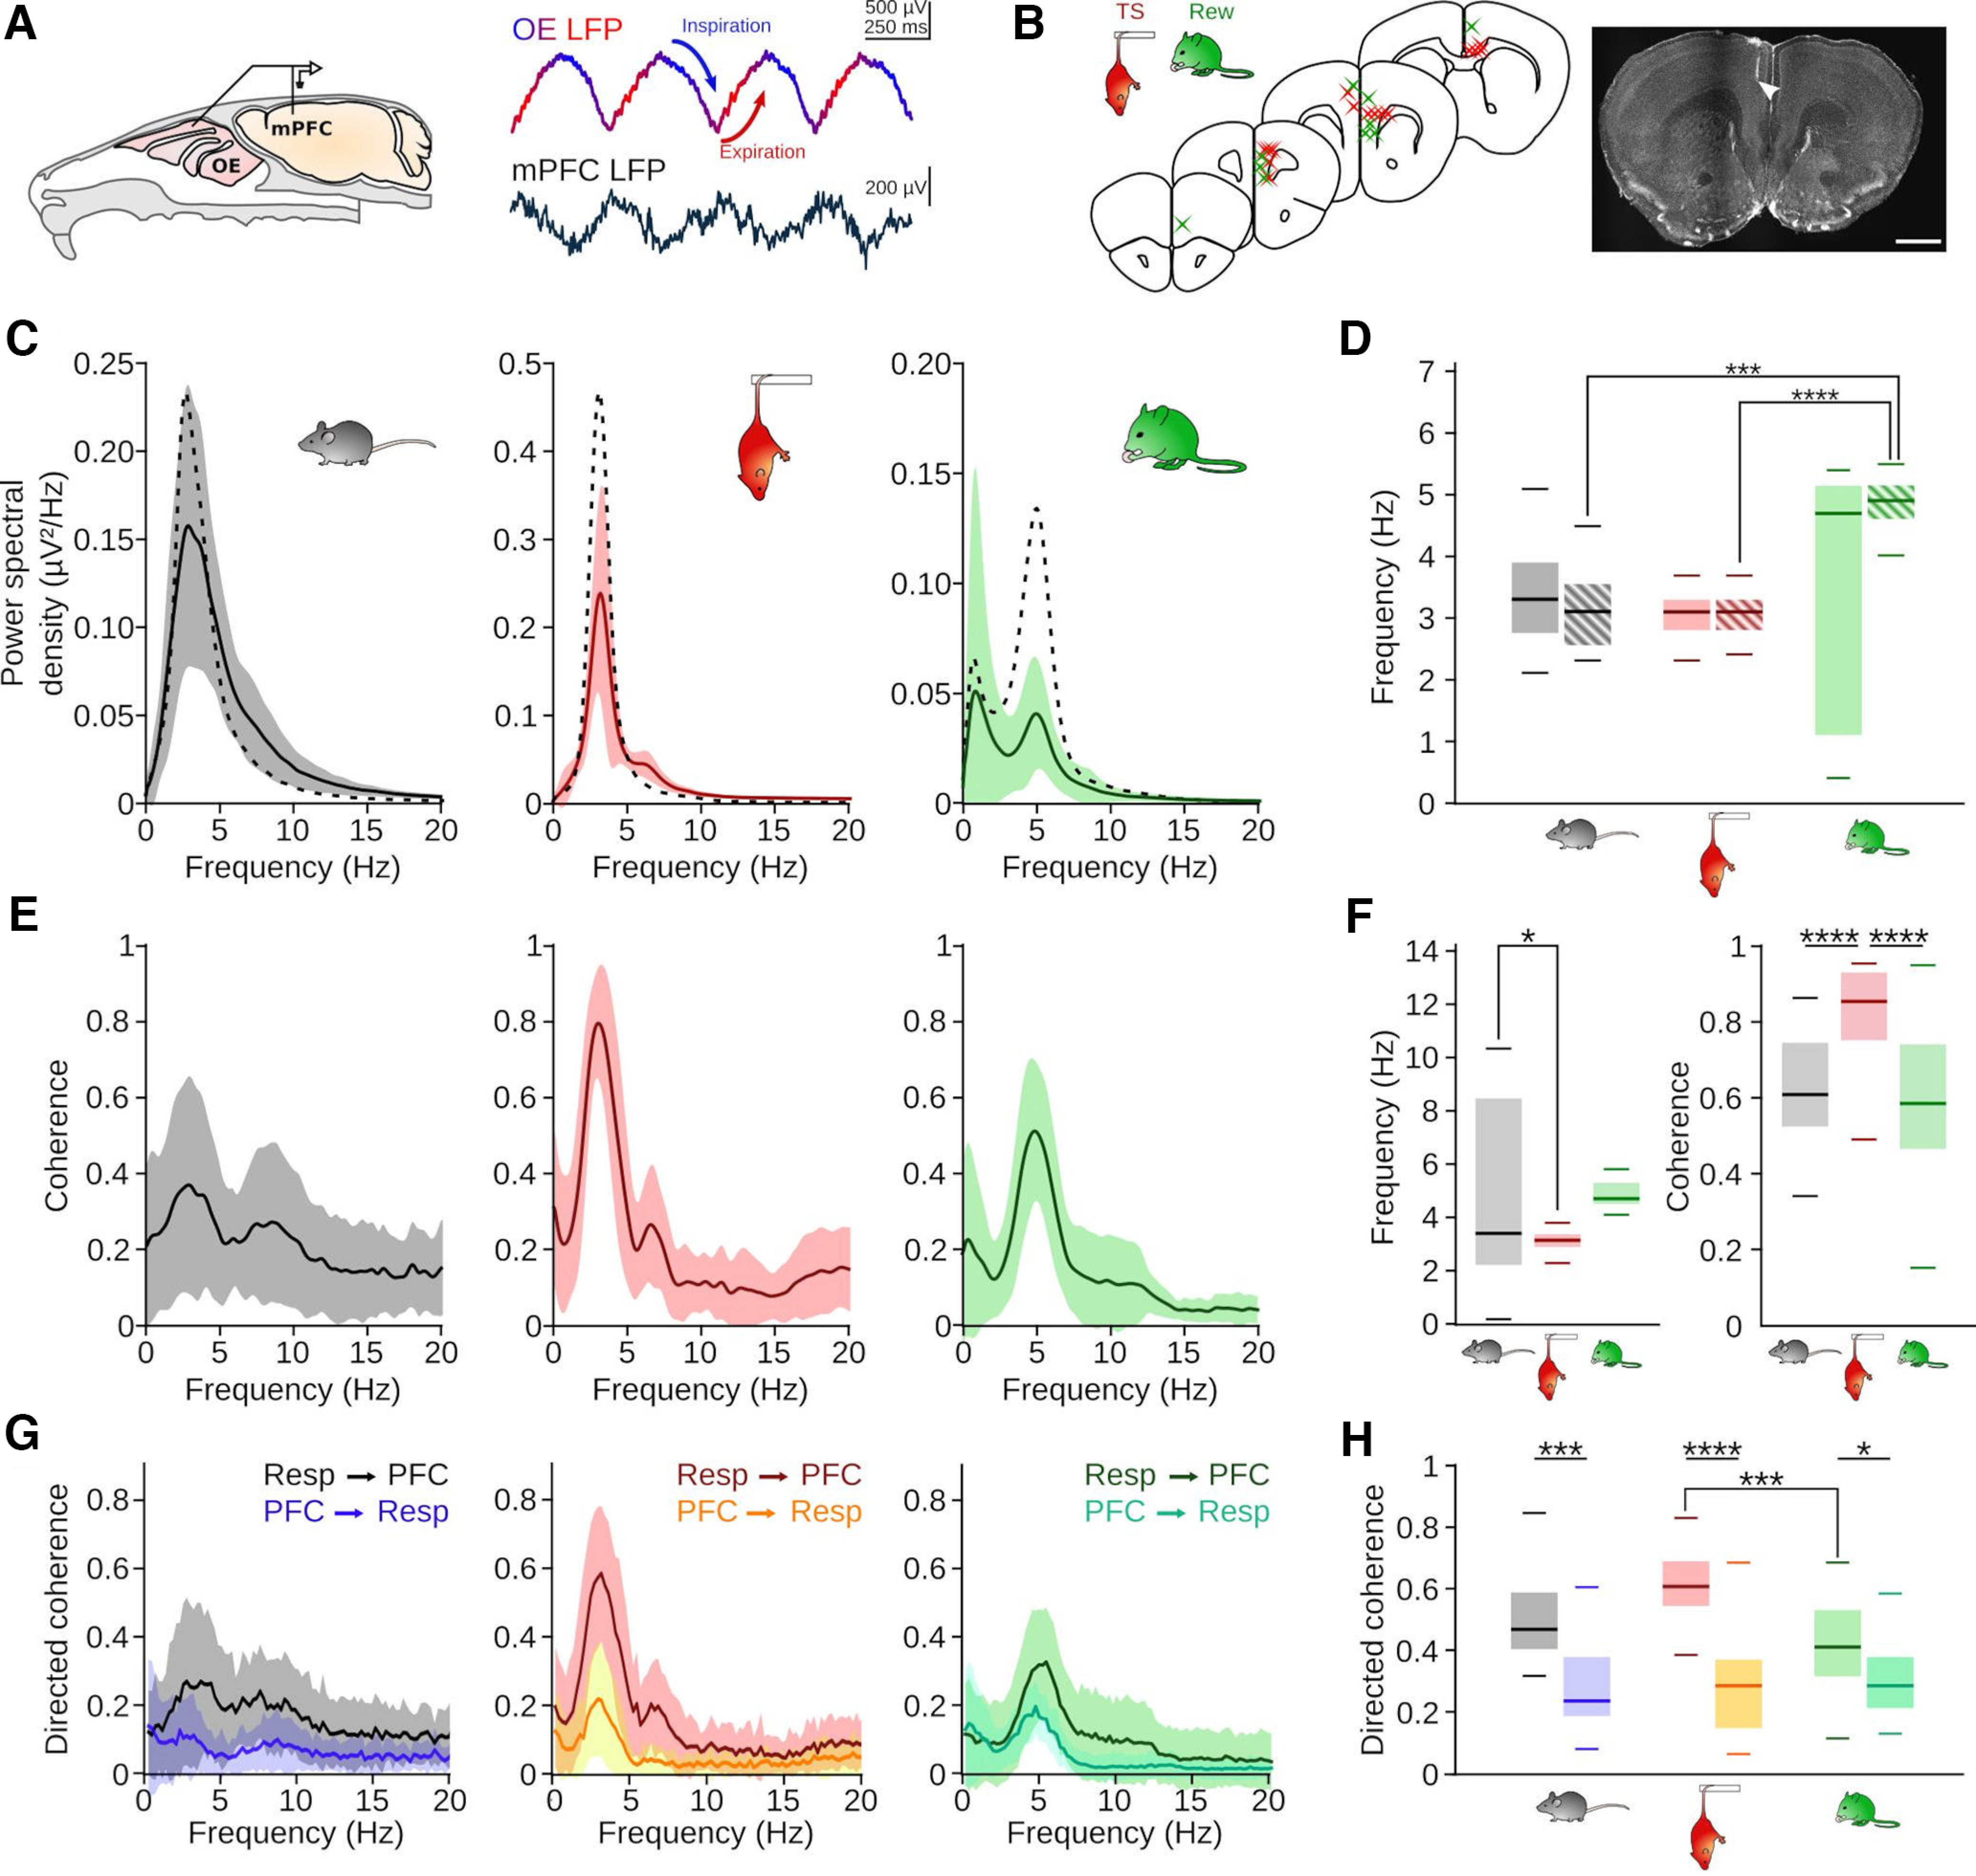
State-dependent emergence of respiration-driven oscillations. A, Left, Schematic of the recording setup. Right, Example traces of the OE and mPFC LFP during TS (1-300 Hz bandpass-filtered). B, Summary (left) and example (right) of recording locations during HC and TS (red) and Rew (green). Scale bar, 1 mm. C, Average (full line indicates mean; shaded area represents SD) PSD of the prefrontal LFP during HC (n = 27 sessions/9 mice), TS (n = 33 sessions/10 mice), and Rew (n = 43 sessions/9 mice). Superimposed dashed line indicates the corresponding mean respiration PSD. D, Frequencies of maximal LFP (full boxes, HC vs TS: z = 1.37, p = 1; HC vs Rew: z = 0.91, p = 1; TS vs Rew: z = 2.51, p = 0.109) and respiration PSD (striped boxes, HC vs TS: z = 0.01, p = 1; HC vs Rew: z = 4.16, p = 2.8 × 10⁻⁴; TS vs Rew: z = 4.43, p = 8.5 × 10⁻⁵). Two-way ANOVA (effect of behavior: F = 8.01, df = 2, p = 4.5 × 10⁻⁴, signal origin: F = 1.41, df = 1, p = 0.24, interaction: F = 3.27, df = 2, p = 0.04) followed by Dunn post hoc tests (df = 5). E, Coherence between respiration and the mPFC LFP during HC (left, n = 30 sessions/8 mice), TS (middle, n = 31 sessions 9 mice), and Rew (right, n = 42 sessions/9 mice). F, Left, Frequencies of maximal coherence between the respiration and the mPFC LFP (HC vs TS: T = 2.95, p = 0.01; HC vs Rew: T = 1.14, p = 0.49; TS vs Rew: T = −2.03, p = 0.11, one-way ANOVA followed by Tukey post hoc tests, df = 1). Right, Values of peak coherence shown in E (HC vs TS: z = 4.26, p = 6.2 × 10⁻⁵; HC vs Rew: z = 0.67, p = 1; TS vs Rew: z = 5.25, p = 4.6 × 10⁻⁷, Kruskal–Wallis test followed by Dunn post hoc tests, df = 2). G, Directed coherence between respiration and mPFC LFP in forward and reverse direction. H, Maximal directed coherence values of the graphs shown in G. Two-way ANOVA identified effects of behavioral state (F = 10.03, df = 2, p = 7 × 10⁻⁵) and direction (F = 111.7, df = 1, p = 5 × 10⁻²¹) with a state × direction interaction effect (F = 12.66, df = 2, p = 6.6 × 10⁻⁶). Forward vs reverse: HC: z = 4.31, p = 1.5 × 10⁻⁴; TS: z = 7.10, p = 1.1 × 10⁻¹¹; Rew: z = 3.08, p = 0.019. Forward: HC vs TS: z = 2.29, p = 0.19; TS vs Rew: z = 4.36, p = 0.0002; HC vs Rew: z = 1.69, p = 0.15; Dunn post hoc tests (df = 5). *p < 0.05. ***p < 0.001. ****p < 0.0001.