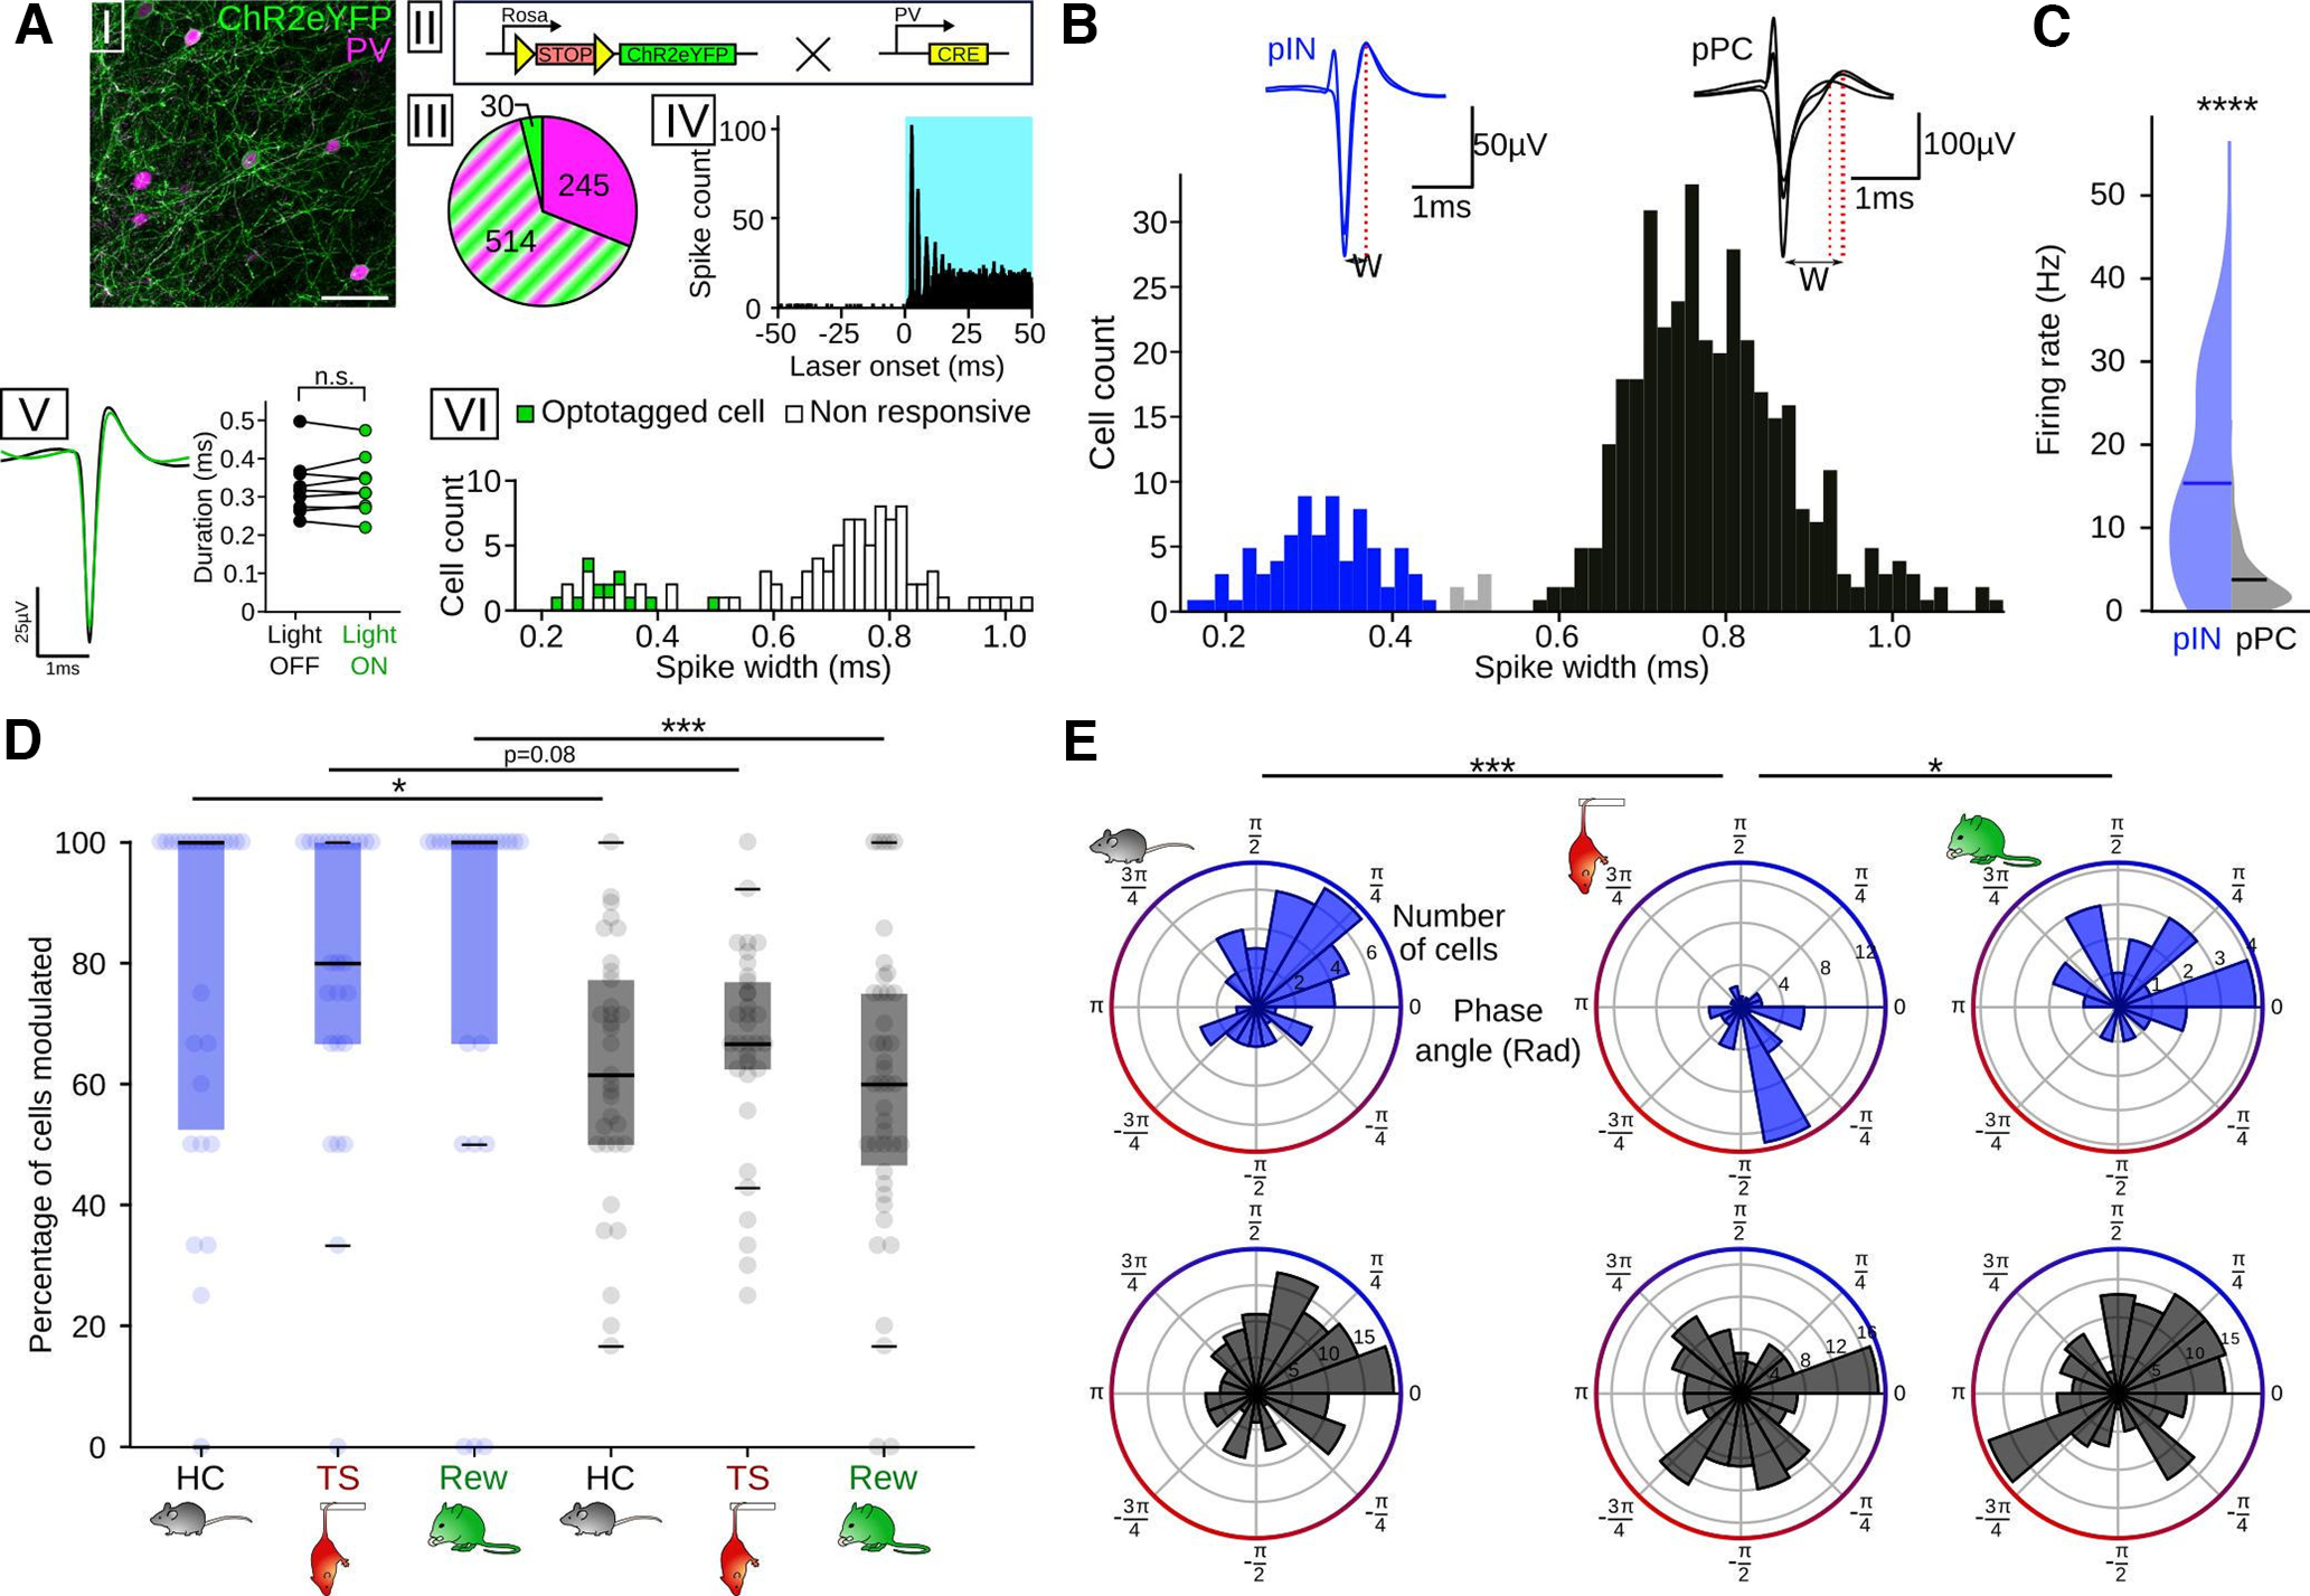
Figure 5.

Differential respiration entrainment of pINs and pyramidal cells. A, Opto-identification of PVIs. AI, Immunostaining against PV (magenta) in PVxAI32 mice. Scale bar, 50 µm. AII, Mice for opto-identification were obtained by crossing AI32 mice (left), expressing a conditional allele of ChR2-eYPF, and a line expressing Cre-recombinase under the control of the PV promoter. The resulting offspring expresses ChR2 in PVIs. AIII, Cell count (n = 3 mice) of neurons expressing ChR2-eYFP (green), PV (magenta), or both (green and magenta stripes). AIV, Summed light-triggered spiking of an identified PVI centered on laser onset (n = 1815 stimulations, 472 nm). Note the reliable peak response occurring ∼2.6 ms after laser onset. AV, Left, Mean spike shape of the single unit in AIV during baseline (black) and under light stimulation (green). Right, Spike duration did not differ between light on (green) and off conditions (black, n = 9 cells/2 mice, Wilcoxon signed rank test, T = 21, df = 8, p = 0.91). AVI, Binned spike widths of opto-identified PVIs (green) and nonresponsive cells recorded simultaneously (white). All identified PVIs had a spike width <0.5 ms. B, Top, Example of the spike shape of a pIN (blue) and pPC (black). W, Spike width. Bottom, Binned spike widths of prefrontal neurons recorded in HC. Blue represents pINs (n = 76). Black represents pPCs (n = 367). Gray represents unclassified cells (n = 6). Three outliers (spike width 1.61, 1.63, and 2.64 ms) are omitted from the histogram. C, Firing rate of pINs (blue, n = 76) and pPCs (n = 367) during HC. PINs had a significantly higher firing rate (t = 15.15, df = 441, p = 4.7 × 10−42, unpaired t test). D, Percentage of cells modulated by respiration (pIN HC: n = 26 sessions/10 mice; pIN TS: n = 26 sessions/10 mice; pIN Rew: n = 25 sessions/8 mice; pPC HC: n = 33 sessions/10 mice; pPC TS: n = 33 sessions/10 mice; pPC Rew: n = 42 sessions/9 mice). Two-way ANOVA for an effect of cell type: F = 17.87, df = 1, p = 0.0004, HC: z = 2.59, p = 0.029; TS: z = 2.18, p = 0.08; Rew: z = 3.63, p = 0.008, Dunn post hoc tests, df = 5). E, Same as in Figure 4D, but segregated for pIN (top, blue, HC: n = 48 cells; TS: n = 46 cells; Rew: n = 22 cells) and pPC (bottom, black, HC: n = 165 cells; TS: n = 154 cells; Rew: n = 172 cells). All measures of preferred population phase, except for pPC during TS (z = 1.2, p = 0.297) and pPC during Rew (z = 2.7, p = 0.067), showed a significant nonuniform distribution (z = 12.7-5.3, p = 2.4 × 10⁻⁶ to p = 0.004, Rayleigh tests, df = 2). Preferred phases: PIN: HC vs TS: df = 50, p = 8 × 10⁻⁵; Rew vs TS: df = 50, p = 0.004; all other comparisons, p > 0.82, two-sample random permutation tests with Bonferroni correction. *p < 0.05. ***p < 0.001. ****p < 0.0001.
