
Figure 6.
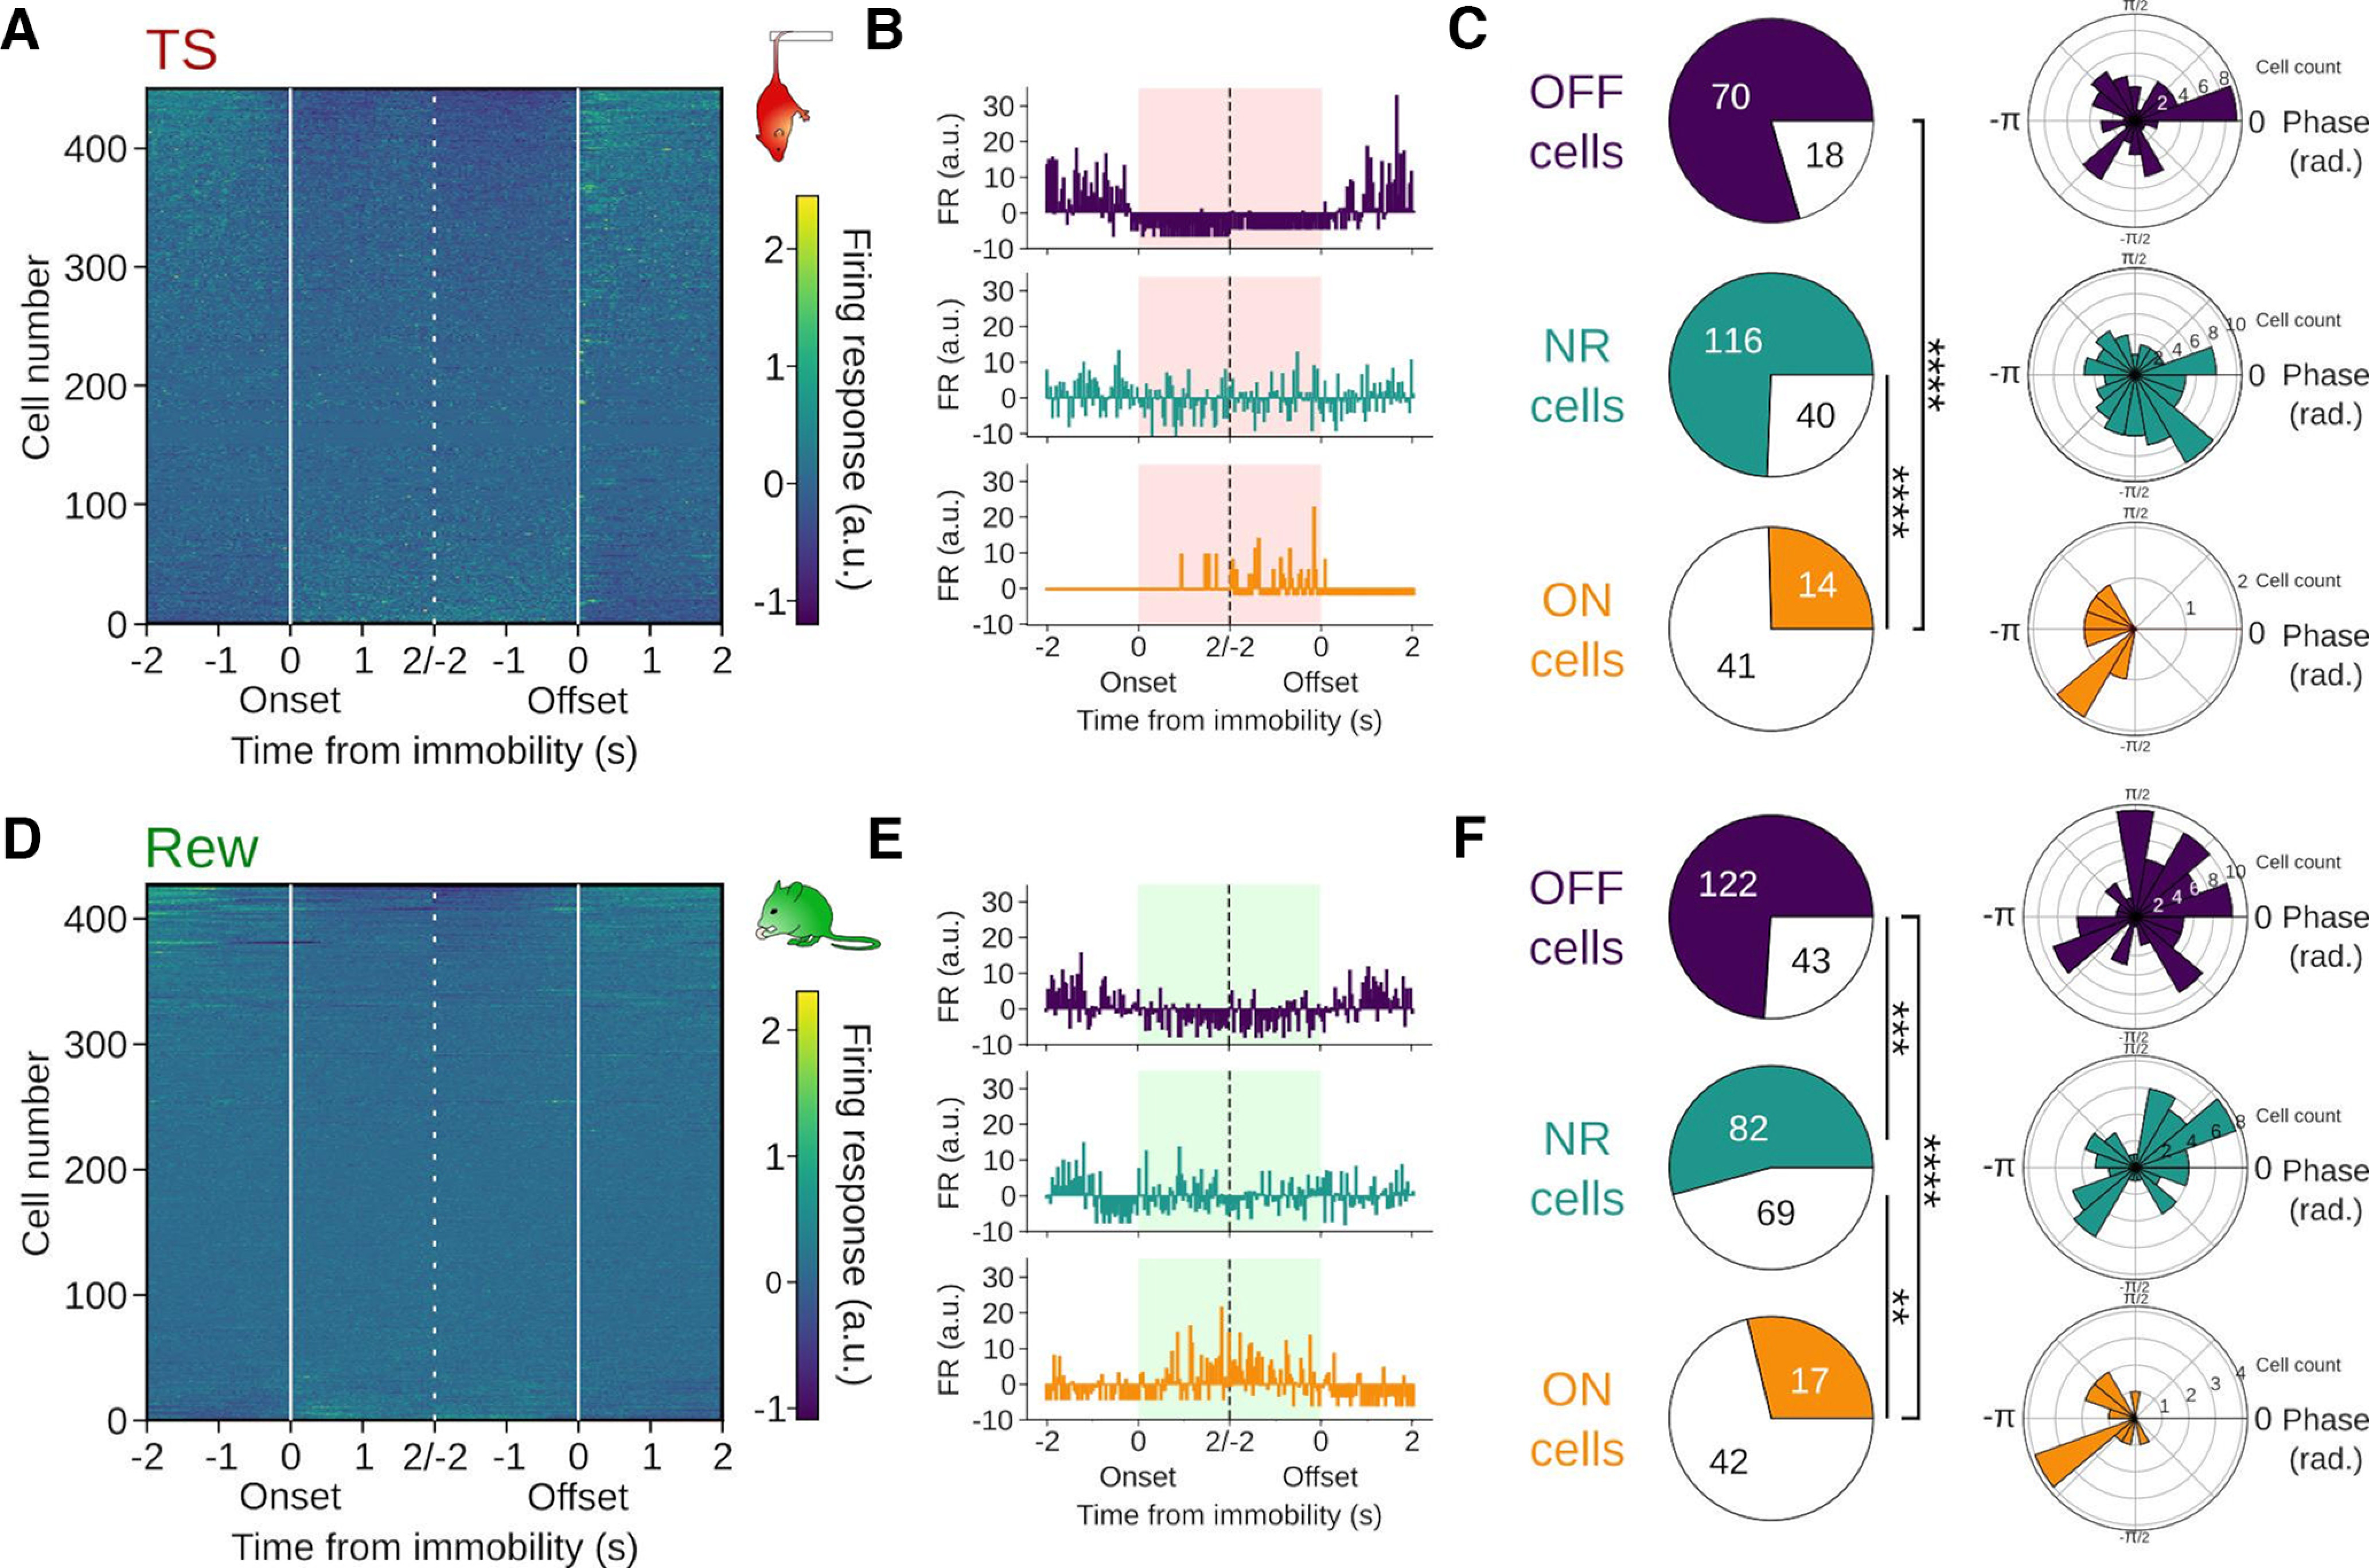
Respiration entrainment of functionally distinct types of pPCs. A, D, Mean firing rate (z-scored) of all mPFC single units aligned to immobility onset and offset during TS (A, n = 449 cells/10 mice) and Rew (D, n = 428 cells/9 mice). Cells are shown sorted by their activity during immobility. B, E, Summed firing responses of pPCs aligned to immobility onset and offset. Firing response was computed as the z score of 4 s binned spike train snippets centered on behavioral transitions. Top, Example of an OFF cell: pPC with a significant change in firing response at transition and a decrease in firing rate during immobility. Middle, Example cell with no firing response (NR). Bottom, Example of an ON cell: pPC with a significant change in firing response at transition and an increase in firing rate during immobility. C, F, Left, Proportion of pPCs modulated by respiration among the OFF (C, n = 88 cells/7 mice; F, n = 165 cells/9 mice), NR (C, n = 156 cells/8 mice; F, n = 151 cells/9 mice), and ON cells (C, n = 55 cells/9 mice; F, n = 59 cells/8 mice). TS: OFF vs ON: p = 0, ON vs NR: p = 0, OFF vs NR: p = 0.097, χ2 = 60.34, df = 2. Rew: OFF vs ON: p = 0, ON vs NR: p = 0.0009, OFF vs NR: p = 0.0003, χ2 = 38.81, df = 2. Right, Preferred respiration phase of pPCs for significantly respiration-entrained OFF, NR, and ON cells. Both ON populations (TS: z = 3.9, p = 0.014, Rew: z = 5.1, p = 0.004), Rew OFF (z = 4.3, p = 0.014), and TS NR cells (z = 3.1, p = 0.04) but not TS OFF (z = 0.4, p = 0.695) and Rew NR cells (z = 1.1, p = 0.348, Rayleigh tests, df = 2) showed a significant nonuniform distribution. Significance thresholds after Bonferroni correction: **p < 0.003; ***p < 0.0003; ****p < 0.00,003.