Figure 1.

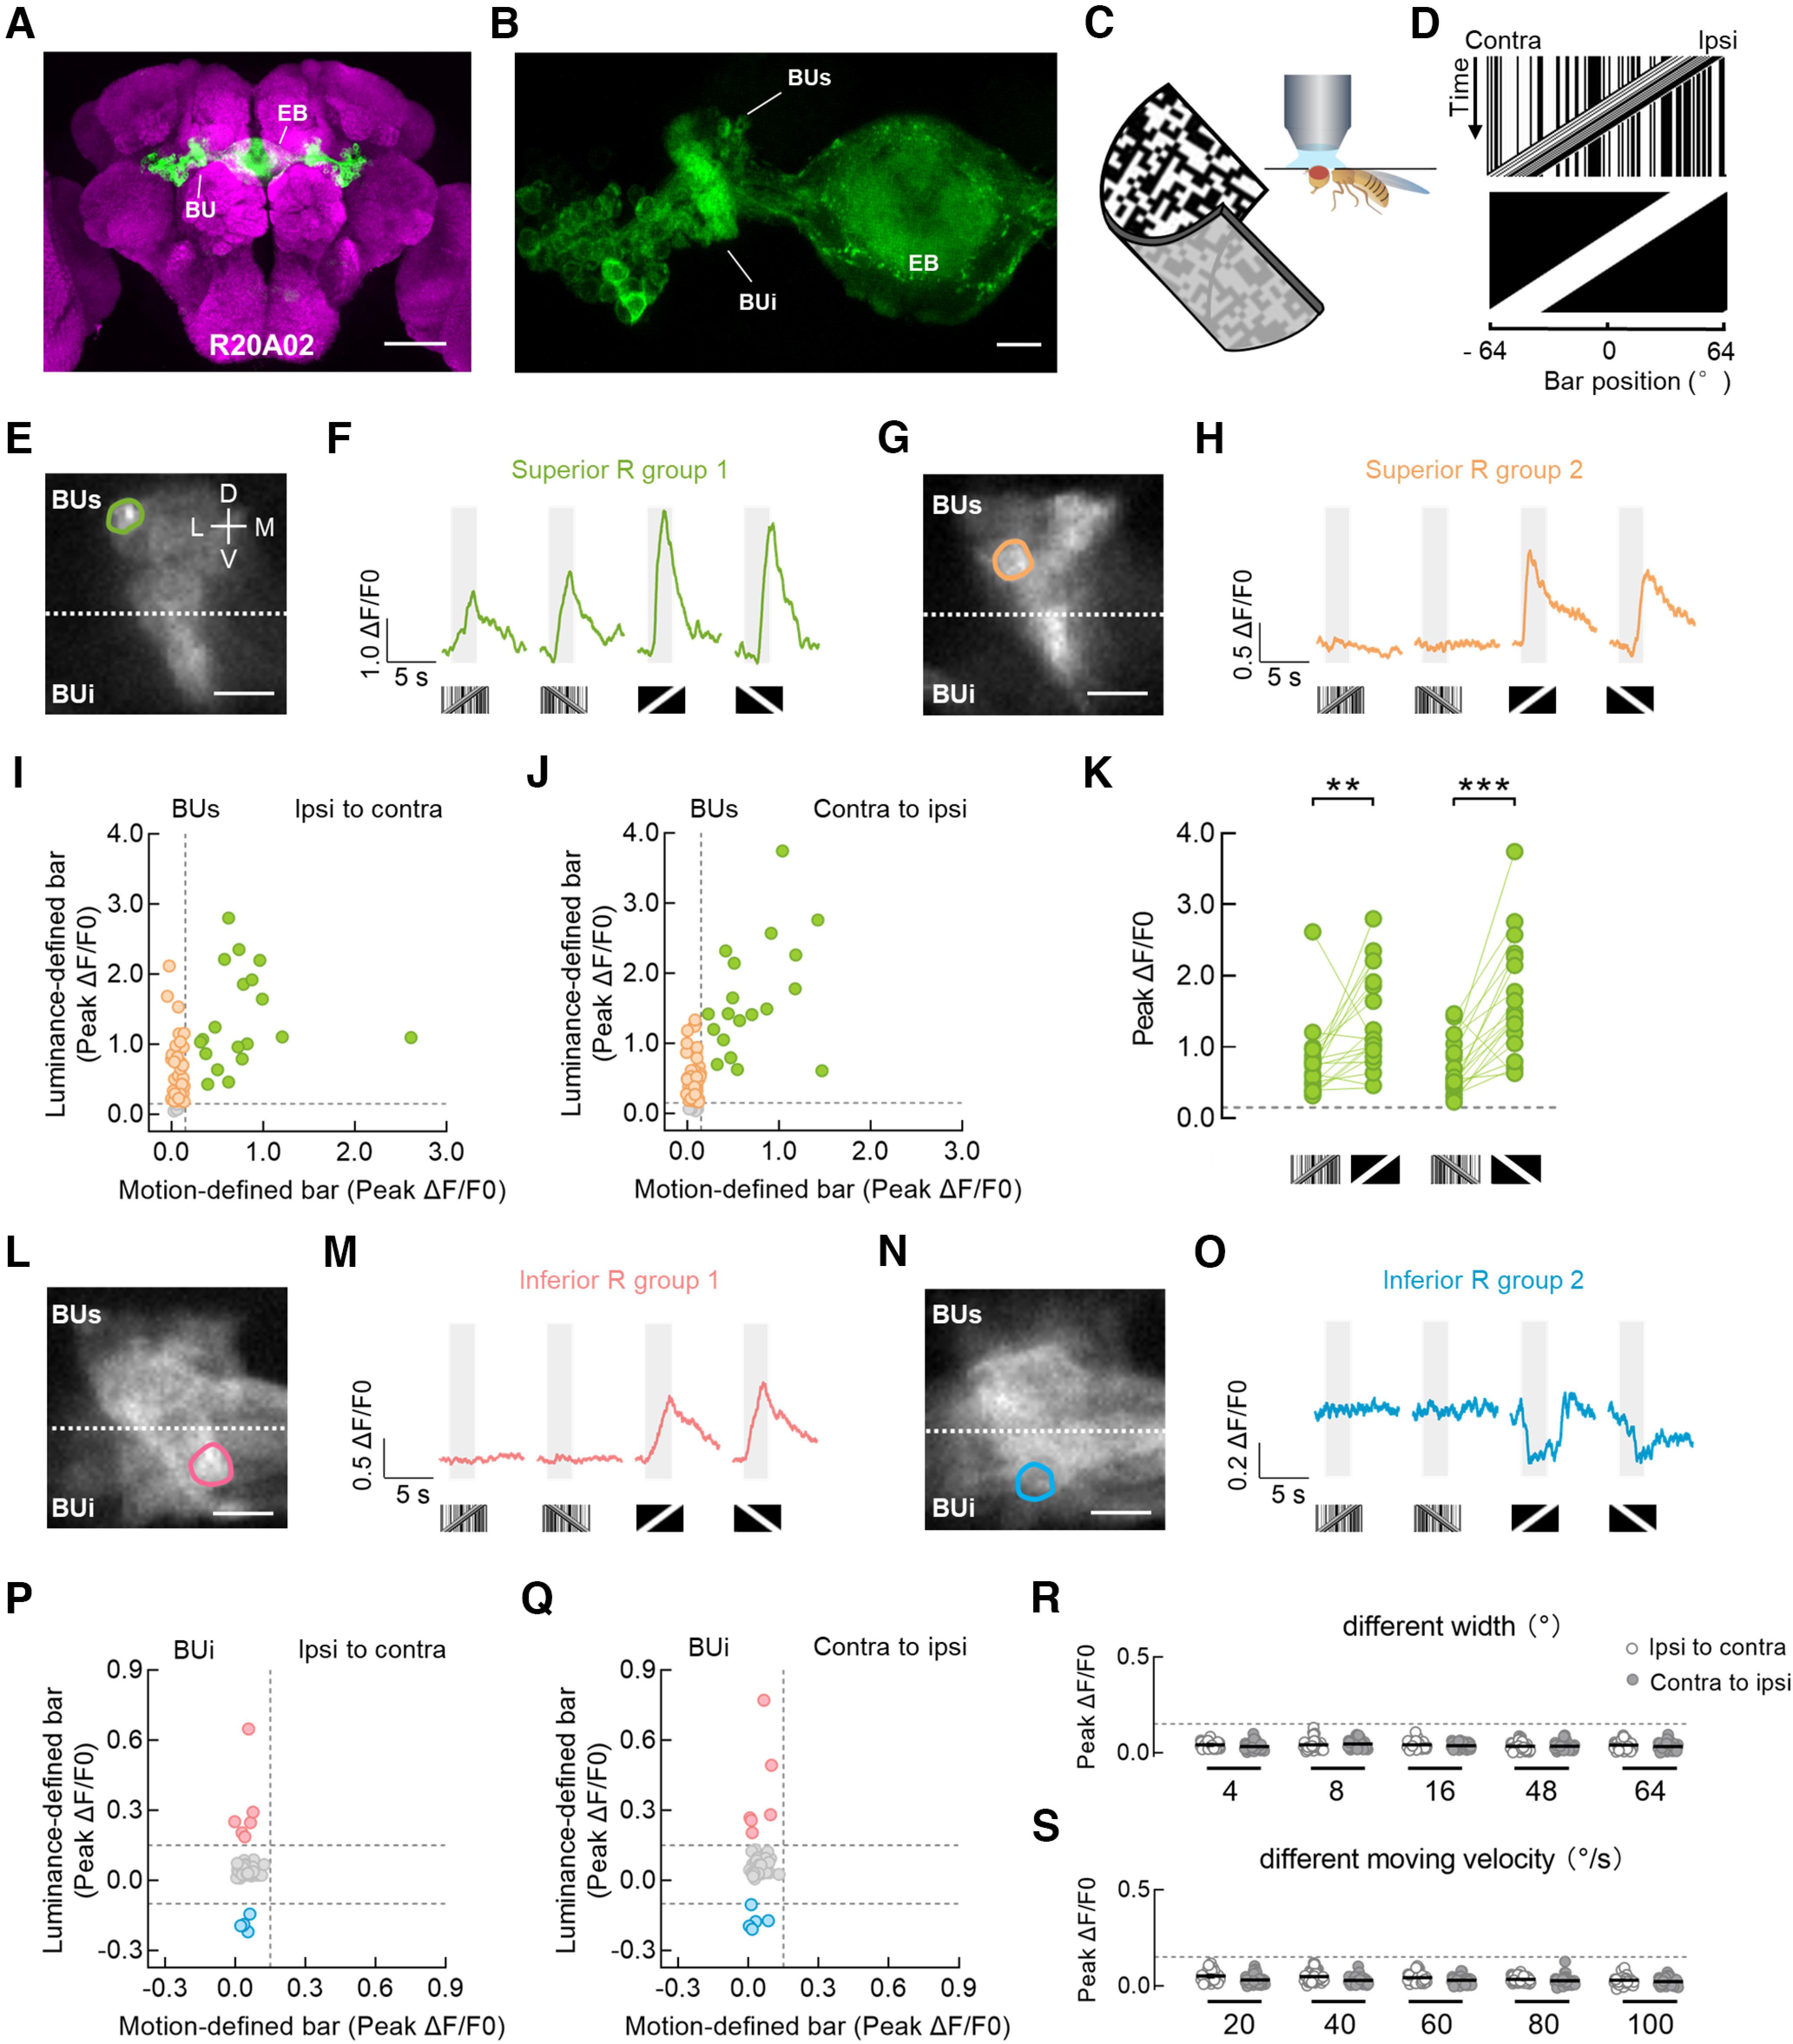
Bulb microglomeruli of ring neurons respond distinctly to different bar stimuli. A, Anatomy of R neurons labeled by R20A02-GAL4 driving the expression of UAS-mCD8::GFP (green) in the central brain. Neuropil was immunostained with anti-Bruchpilot (magenta). EB, ellipsoid body; BU, bulb. Scale bar, 100 μm. B, The drive line in A targeted most of the R neurons (green) innervating the superior bulb (BUs) and inferior bulb (BUi). Scale bar, 10 μm. C, Setup for the two-photon in vivo calcium imaging experiments. D, Space–time plots for a 30° × 64° motion-defined bar (top) and a 30° × 64° luminance-defined bar (bottom) that were moving at 40°/s from the Ipsi to the Contra side of the right bulb. These bars are used in E−Q. E, F, Two-photon excitation image (E) and calcium responses (F) of an example microglomerulus in the superior bulb. The superior and inferior neuropils are classified as the top and bottom regions, respectively, divided by the dotted line (E). The example cell exhibited excitation to both motion- and luminance-defined bars. This cell type is referred to as the superior R group 1. Visual stimuli were presented in both horizontal directions. For each stimulus, response from a single trial is shown in F. The gray-shaded regions represent duration of stimulation (2.5 s). D, Dorsal; V, ventral; M, medial; L, lateral. G, H, Two-photon excitation image (G) and calcium responses (H) of another example microglomerulus in the superior bulb. The example cell did not respond to motion-defined bars but was excited by luminance-defined bars. This cell type is referred to as the superior R group 2. I, J, Peak calcium responses from all recorded superior R neurons to ipsi-to-contra motion (I) and contra-to-ipsi motion (J). Each dot represents a single microglomerulus. ROIs with the same color showed homogeneous visual responses. Superior R group 1 neurons are indicated as green dots; n = 19 ROIs in 10 flies. Superior R group 2 neurons are indicated as orange dots; n = 44 ROIs in 10 flies. Microglomeruli that did not respond to any of our stimuli are indicated as gray dots (bottom); n = 5 ROIs in 10 flies. The horizontal and vertical dotted lines indicate 0.15 ΔF/F0. K, Comparison of peak responses from the superior R group 1 neurons between a motion-defined bar and a luminance-defined bar. Left, stimuli moved from ipsi to contra; Wilcoxon matched-pairs signed-rank test, W = 142, p = 0.0028. Right, stimuli moved from contra to ipsi; Wilcoxon matched-pairs signed-rank test, W = 142, p = 0.0001. The horizontal dotted line indicates 0.15 ΔF/F0. L, M, Two-photon excitation image (L) and calcium responses (M) of an example microglomerulus in the inferior bulb. The example cell was insensitive to motion-defined bars but was activated by luminance-defined bars. This cell type is referred to as the inferior R group 1. N, O, Two-photon excitation image (N) and calcium responses (O) of another example microglomerulus in the inferior bulb. The example cell did not respond to motion-defined bars but was inhibited by luminance-defined bars. This cell type is referred to as the inferior R group 2. Scale bars: E, G, L, N, 10 μm. P, Q, Peak calcium responses from all recorded inferior R neurons to ipsi-to-contra motion (P) and contra-to-ipsi motion (Q). Inferior R group 1 neurons are indicated as pink dots; n = 6 ROIs in 10 flies. Inferior R group 2 neurons are indicated as blue dots; n = 5 ROIs in 10 flies. Microglomeruli that did not respond to any of our stimuli are indicated as gray dots; n = 37 ROIs in 10 flies. The top and bottom horizontal dotted lines indicate 0.15 ΔF/F0 and −0.10 ΔF/F0, respectively. The vertical dotted line indicates 0.15 ΔF/F0. R, Peak calcium responses of inferior R neurons to motion-defined bars of varying bar width (4°, 8°, 16°, 48°, and 64°). Each bar moved at 40°/s in both horizontal directions; n = 41 ROIs in 6 flies. The horizontal dotted line indicates 0.15 ΔF/F0. Black lines indicate mean ± SEM across microglomeruli. S, Peak calcium responses of inferior R neurons to a 30° × 64° motion-defined bar moving at 20°−100°/s. Each bar was presented in both horizontal directions; n = 47 ROIs in 6 flies. The horizontal dotted line indicates 0.15 ΔF/F0. Black lines indicate mean ± SEM across microglomeruli. ***p < 0.001, **p < 0.01.
