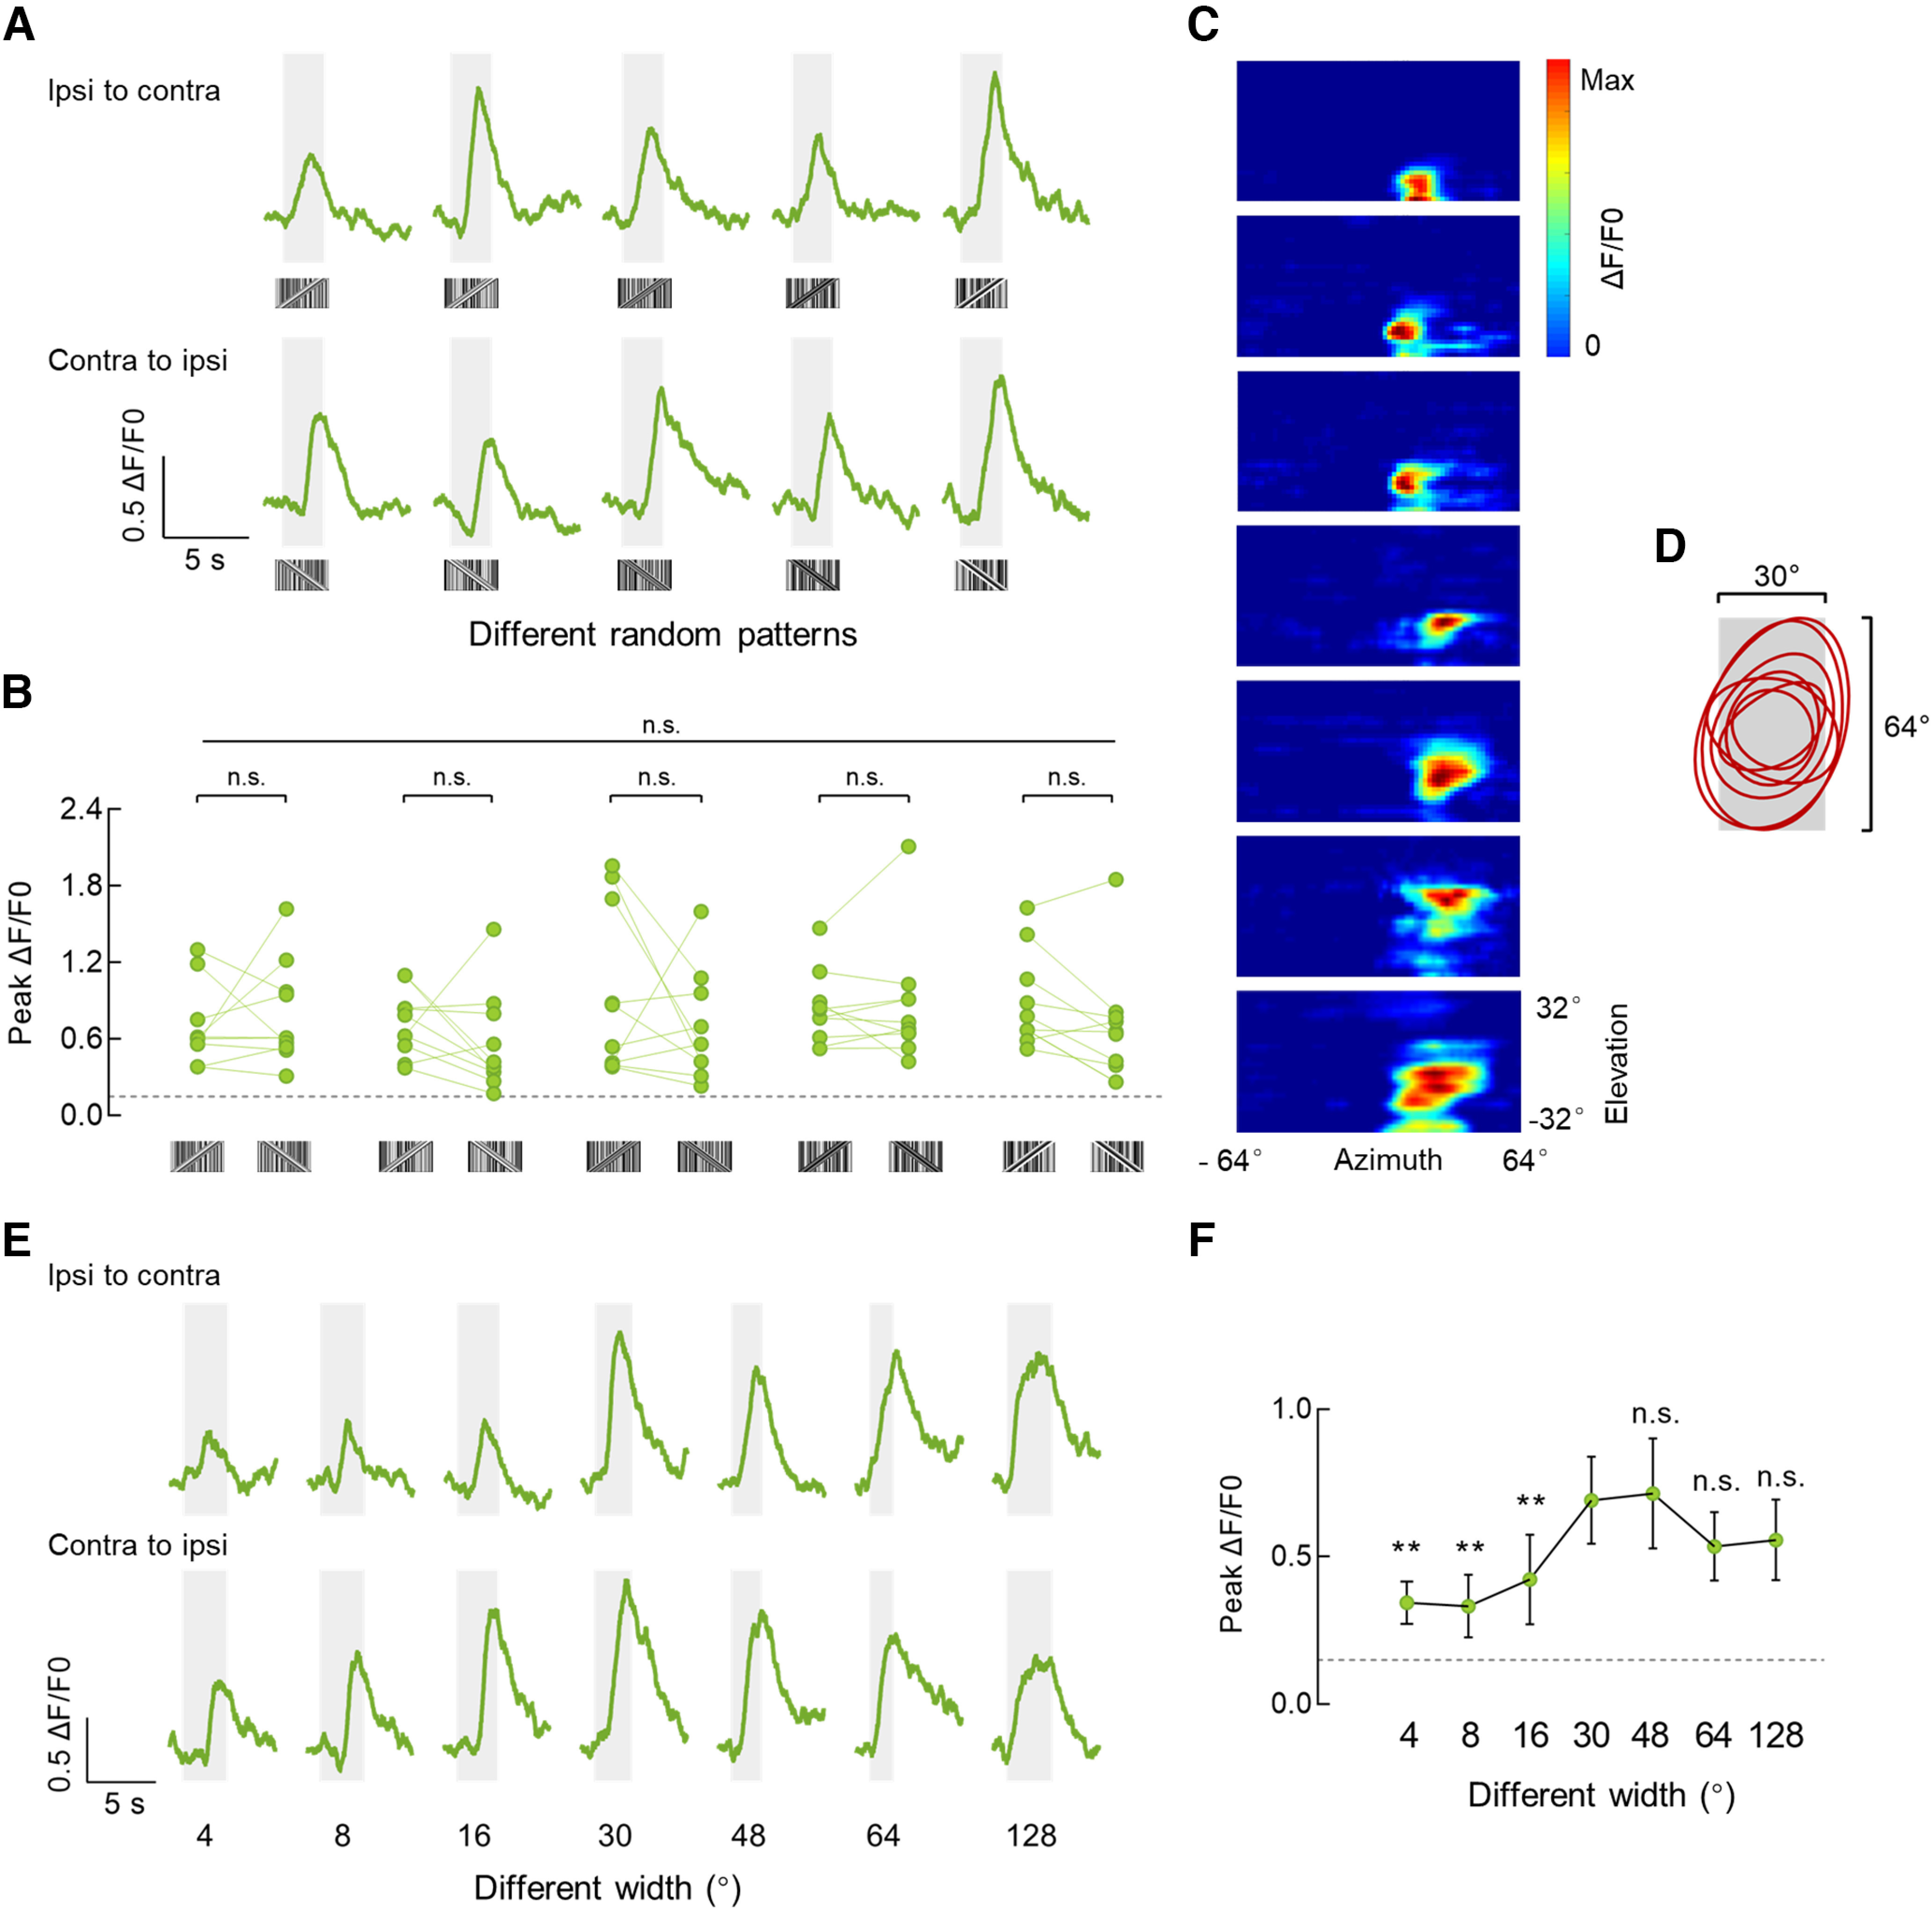
Figure 2.

Physiologic properties of the superior R neurons that are sensitive to motion-defined bars. A, Calcium responses of an example superior R neuron to 30° × 64° motion-defined bars with five different random patterns. Stimuli were presented in both horizontal directions at 40°/s. The gray-shaded regions represent duration of stimulation (2.5 s). B, Comparison of peak responses from all recorded microglomeruli (n = 10 ROIs from 6 flies) to motion-defined bars with five different random patterns. Repeated-measures ANOVA (Friedman test) was used to compare all five groups (top, long line), Friedman's F = 17.56, n.s., p = 0.0923. For each pattern, peak responses to the bar moving in two horizontal directions were compared (bottom, short lines). Two-tailed paired t test was used for the fourth pattern, and Wilcoxon matched-pairs signed-rank test was used for other patterns. From the first to the fifth pattern, W = 7, p = 0.7695; W = 25, p = 0.2324; W = 19, p = 0.3750; t(9) = 2.076, p = 0.0677; W = 37, p = 0.0645. The horizontal dotted line indicates 0.15 ΔF/F0. C, Receptive field maps for microglomeruli of R neurons that were responsive to motion-defined bars; n = 7 ROIs in 5 flies. A 2° ON square object moved at 32 different elevations in both directions was used to map the receptive field. D, The contours (25% maximum) of all estimated receptive fields in C. The gray-shaded region indicates a 30° × 64° bar stimulus. E, Calcium responses of an example superior R neuron to motion-defined bars of varying bar width (4°, 8°, 16°, 30°, 48°, 64°, and 128°). Each bar moved at 40°/s in both horizontal directions. F, Peak calcium responses of superior R neurons to motion-defined bars of varying bar width. Peak calcium responses to each bar moving in both directions were averaged; n = 10 ROIs in 6 flies. The responses to the 30° bar were compared with those to the bar of other sizes, respectively. All comparisons were analyzed with Wilcoxon matched-pairs signed-rank tests; 30° versus 4/8/16°, W = 55, p = 0.002; 30° versus 48°, W = 7, p = 0.7695; 30° versus 64°, W = 10, p = 0.1309; 30° versus 128°, W = 10, p = 0.2324. The horizontal dotted line indicates 0.15 ΔF/F0. Error bars indicate SEM. **p < 0.01.
