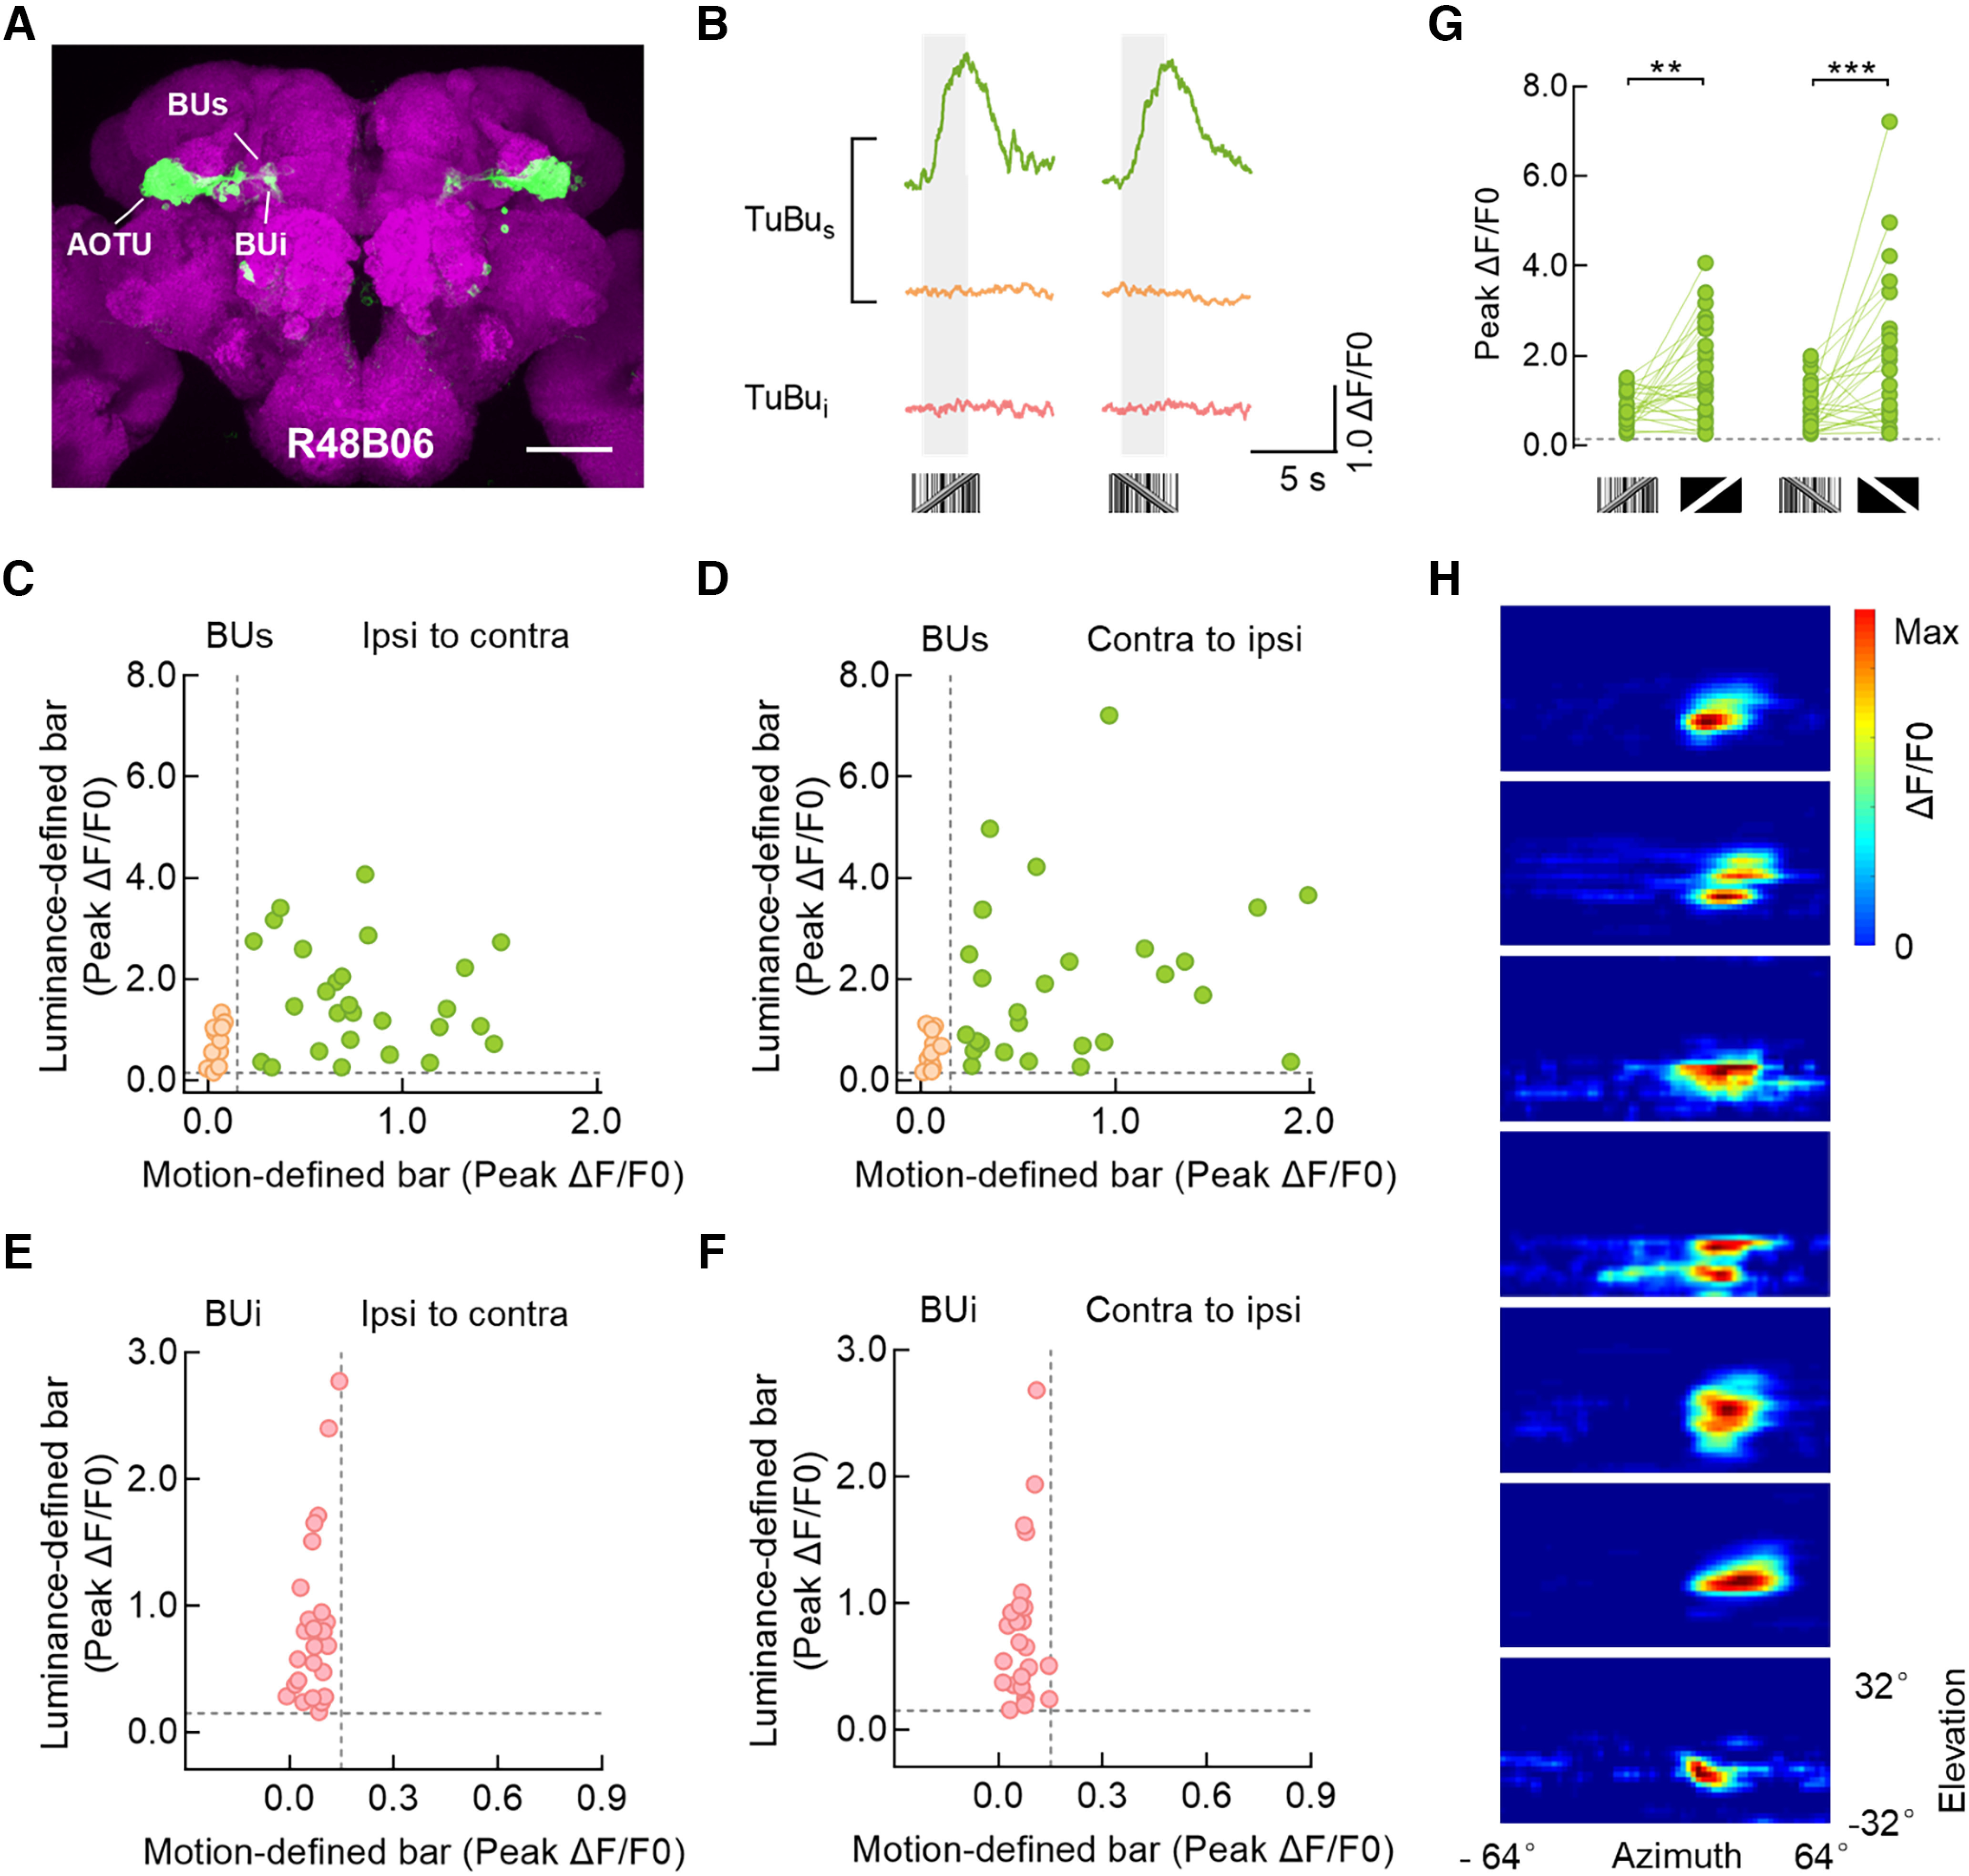
Figure 3.

Superior tuberculo-bulbar neurons respond to a motion-defined bar. A, Anatomy of TuBu neurons labeled by R48B06-GAL4 driving the expression of UAS-mCD8::GFP (green). This driver line labeled TuBu neurons that project from the AOTU to the superior bulb (BUs) and inferior bulb (BUi). Neuropil was immunostained with anti-Bruchpilot (magenta). Scale bar, 100 μm. B, Calcium responses of three example microglomeruli of TuBu neurons to a 30° × 64° motion-defined bar moving at 40°/s. An example cell in the superior bulb responded to a motion-defined bar in both directions (green), whereas another example cell in the superior bulb did not (orange). The example cell in the inferior bulb did not respond to motion-defined bars (pink). The gray-shaded regions represent duration of stimulation (2.5 s). C, D, Peak calcium responses from all recorded TuBus neurons to a 30° × 64° motion- and luminance-defined bar moving at 40°/s from ipsi to contra (C) and contra to ipsi (D). Each dot represents a single microglomerulus. ROIs with the same color showed homogeneous visual responses. ROIs that responded to both motion and luminance-defined bars are indicated as green dots; n = 27 ROIs in 7 flies. ROIs that responded to luminance-defined bars but not motion-defined bars are indicated as orange dots, n = 12 ROIs in 7 flies. The horizontal and vertical dotted lines indicate 0.15 ΔF/F0. E, F, Peak calcium responses from all recorded TuBui neurons to a 30° × 64° motion- and luminance-defined bar moving at 40°/s from ipsi to contra (E) and contra to ipsi (F). ROIs that responded to luminance-defined bars but not motion-defined bars are indicated as pink dots; n = 25 ROIs in 7 flies. The horizontal and vertical dotted lines indicate 0.15 ΔF/F0. G, Comparison of peak responses from the recorded TuBus neurons, green dots in C and D, between a motion- and luminance-defined bar. Left, Stimuli moved from ipsi to contra, two-tailed paired t test, t(26) = 3.704, p = 0.001. Right, Stimuli moved from contra to ipsi; Wilcoxon matched-pairs signed-rank test, W = 298, p = 0.0001. The horizontal dotted line indicates 0.15 ΔF/F0. H, Receptive field maps for microglomeruli of TuBus neurons that were responsive to motion-defined bars; n = 7 ROIs in 6 flies. ***p < 0.001, **p < 0.01.
